At the 06/17/22 bottom the S&P 500 (SPX) had declined 24%, this is second largest percentage decline since the 2007 to 2009 bear market. The largest percentage drop was the February to March 2020 crash of 35%.
The 06/18/22 blog “Dow Jones Industrial Average Long – Term Time Forecast” implied that the early January 2022 peak in US stocks could be the turning point for a multi-year bear market.
If the SPX drop from January 2022 is not complete, where are the next potential support levels?
Point & Figure (PF) charting and Fibonacci analysis reveal some intriguing clues.
The daily SPX – PF chart courtesy of StockCharts.com illustrates potential intermediate and major support zones.
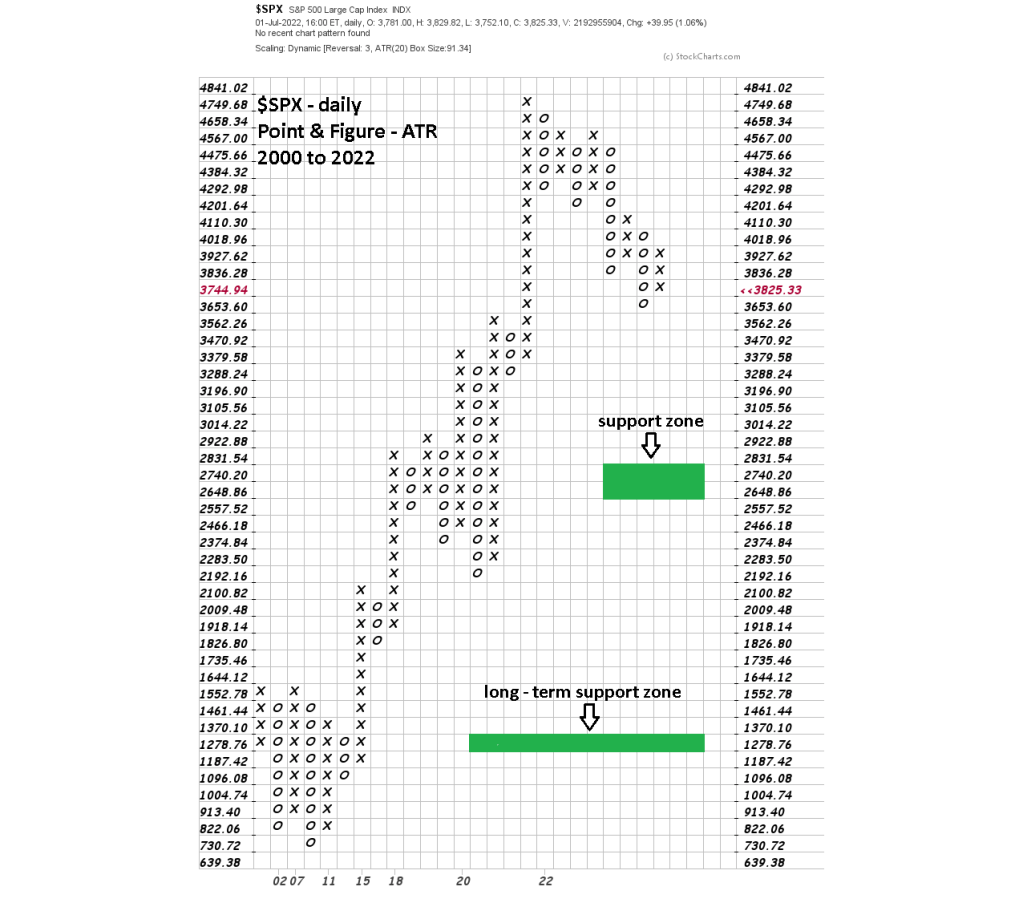
PF support/resistance is determined by the number of “X’s” and “O’s” columns. The greater the number columns indicates the degree of potential strength.
This PF chart uses the Average True Range (ATR) method and shows two potential support areas. Each has rows of seven columns . The first in the SPX 2,650 to 2,830 area could be reached later in 2022, possibly October based on seasonal patterns for US stocks.
The second level in the SPX 1,280 to 1,370 zone. It could take several years for the SPX to reach this level – possibly five – years.
The monthly SPX chart courtesy of Trading View illustrates an important Fibonacci retracement level.
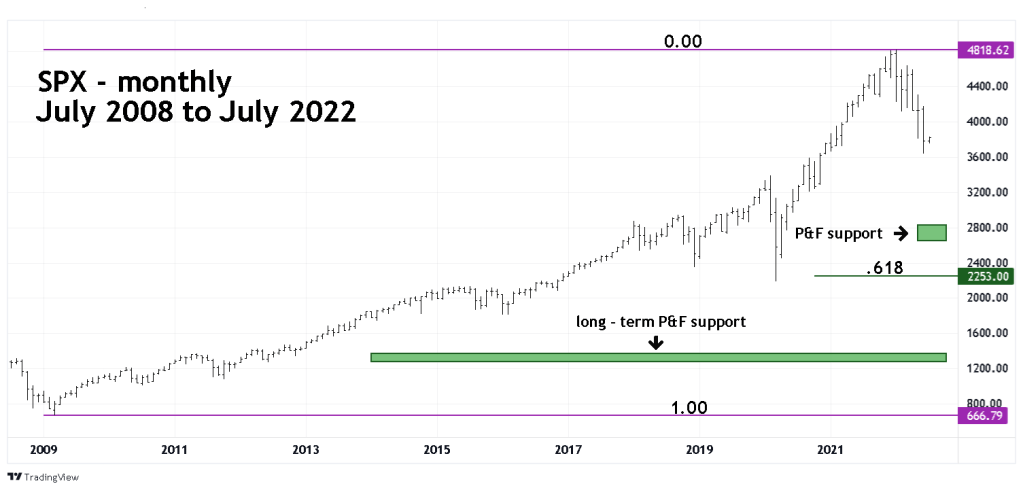
It’s fascinating that a Fibonacci .618 retracement of the 2009 to 2022 bull market is just above the March 2020 bottom at 2,191. Fibonacci support/resistance levels act as magnets and resistors, pulling markets towards them and then stopping the movement.
Additionally, the March 2020 to January 2022 SPX rally moved up faster and farther than almost every US stock bull market since the Dow Jones Industrial Average 1932 to 1937 bull market. Only the Nasdaq 1998 to 2000 rally was stronger, and that was because of the technology stock mania. That movement was the blowoff stage of the much larger bull market that began in 1990.
The SPX March 2020 to January 2022 appears to be the blowoff stage for the secular bull market that began in March 2009. Typically, blowoff moves in markets and stocks will quickly retrace back to their point of origin – in this case the SPX 2,200 area.
How fast is “quickly”? It depends on the speed of the move up, which from March 2020 was 22 – months. A 10 – month drop from January 2022 to October 2022 would be about half the time.
If the bear move that began in January 2022 continues and does not find support in the PF zone of 2,650 to 2,830, its possible it could reach the 2,200 area before the end of the year.
