The daily S&P 500 (SPX) chart courtesy of Trading View illustrates action of the RSI momentum indicator.
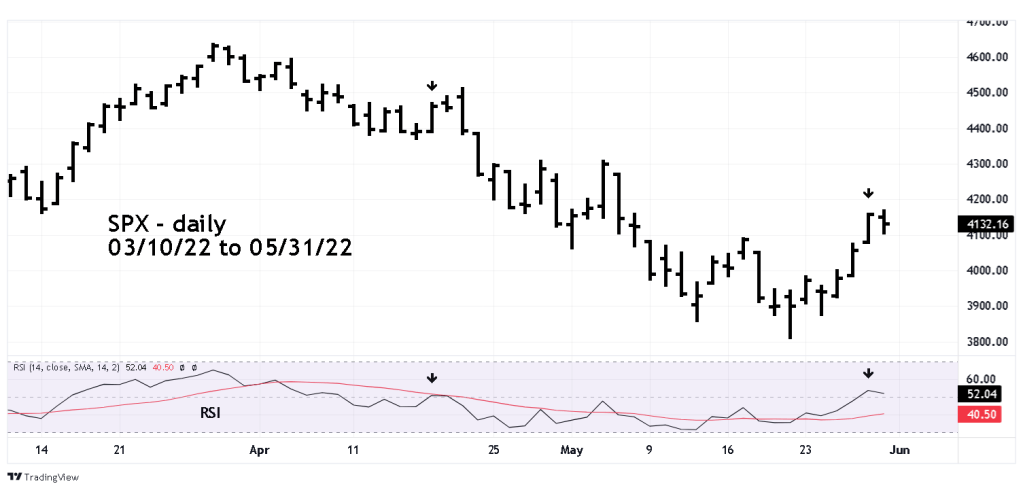
The highest daily SPX closing level after the 05/20/22 bottom was made on 05/27/22 with an RSI reading of 53.72. This is higher than the reading made on 04/19/22 – the highest SPX closing level for the 04/18/22 to 04/21/22. The higher RSI reading at a lower SPX price implies the SPX could soon rally to near the price level made on 04/19/22.
The hourly SPX chart zooms in on the shorter-term momentum.

A Fibonacci .236 retrace of the SPX rally from 05/20/22 to 05/31/22. is at 4083.85. There’s a secondary Fibonacci point at 4081.60 which could be the termination area for an Elliott wave – Expanding Flat corrective pattern that began on 05/27/22. Depending on market action a future blog will detail this potential corrective pattern.
The two close Fibonacci coordinates imply strong support in the 4085 to 4075 area.
Traders are long 100% non-leveraged SPX related funds. Continue holding long.
