The US stock market declines from 1929 to 1932 and 2000 to 2002 reveal clues that could be helpful in determining stock actions in 2022.
The basic principle of Elliott wave theory is that progress is made in five -waves and corrected in three waves. There are three types of corrective patterns, Zigzag, Flat, and Triangle. This blog is focusing on the Zigzag type.
The following illustrates Zigzag corrections of bull trends.

The simplest form is three-waves labeled as “A, B, C.”
Each of the three sub waves further sub divide into a five – three – five patten.
Sometimes the corrections can be more complex, in which the “A” and “C” waves subdivide into smaller Zigzags – these are called Double Zigzags. Occasionally, these patterns could become even more complex. In those situations, the “A” and “C” sub waves of the smaller Zigzag also subdivide into Zigzags.
When you see a choppy market correction its probably Zigzags subdividing into smaller Zigzags.
The Weekly Dow Jones Industrial (DJI) chart courtesy of Trading View illustrates the colossal 1929 to 1932 bear market in US stocks.
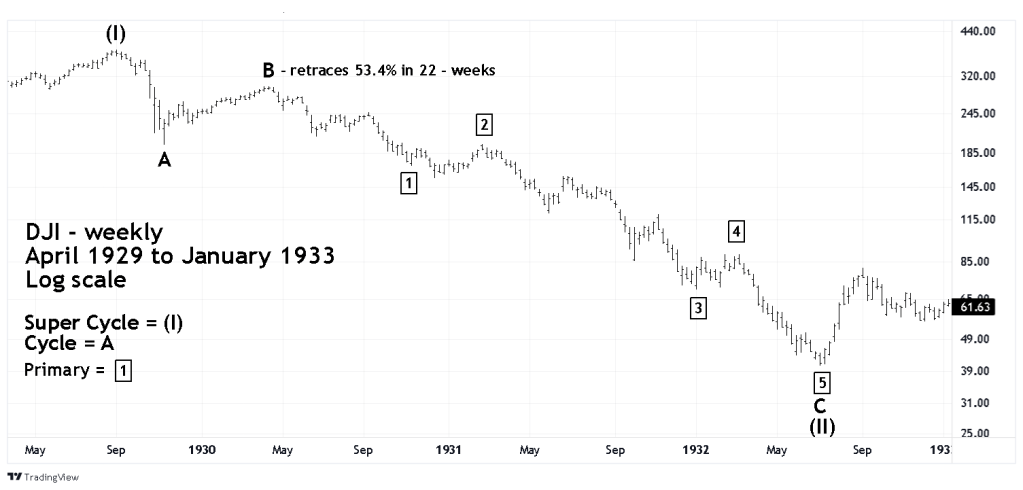
This is a nearly three-year example of a simple Zigzag bear market.
Please closely examine Cycle wave “A” and you will be able to see the five-wave subdivision of the September to November 1929 movement.
The subsequent Cycle wave “B” took 22 – weeks to complete and retraced more than 50% of the prior bear move. At the time many market participants thought it was the start of a new bull market. They would soon receive a rude awakening.
The next Weekly DJI chart illustrates the January 2000 to October 2002 bear market.
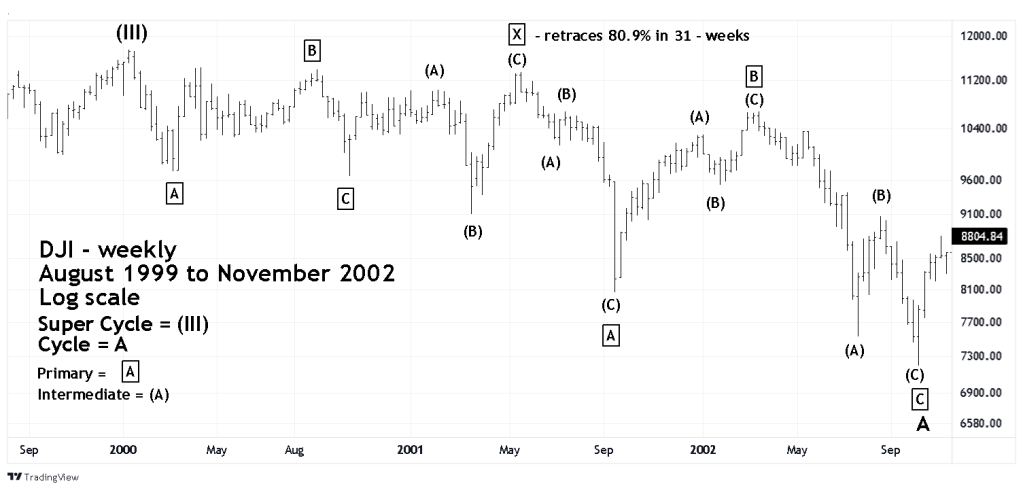
This is a nearly three-year example of a complex Zigzag bear market.
Primary wave “X” took the form of an Elliott wave – Expanding Flat correction lasted 31 -weeks and was 71 – weeks after the final bull market peak made in January 2000.
Note that the subsequent Primary degree “A,B,C” decline subdivided into a Double Zigzag. Another Elliott wave interpretation has the entire 2000 to 2002 bear market as a Triple Zigzag.
The daily DJI chart shows the 2022 decline.
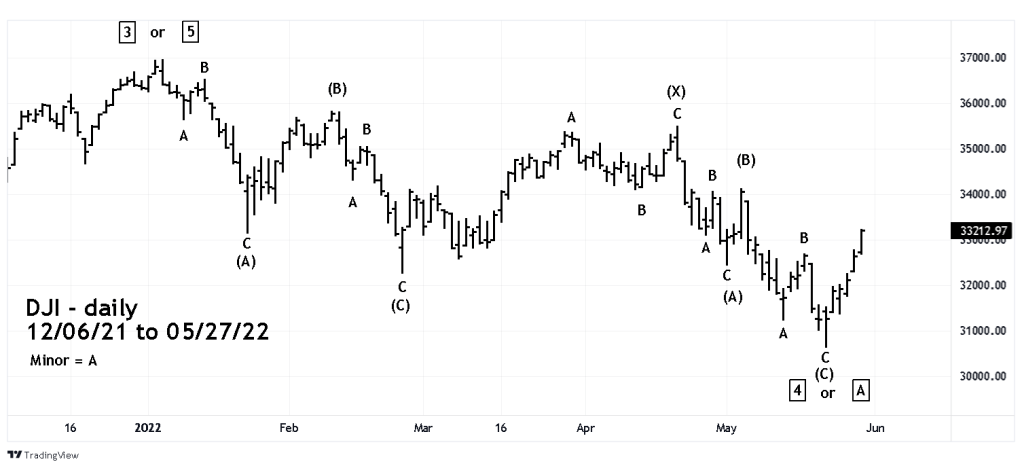
Note the choppy action of the bear move which Intermediate wave (X) separates two double Zigzags. This is an example of a very choppy decline.
The powerful bullish action of US stocks since the 05/20/22 bottom strongly implies higher prices during the next several weeks.
Here are three scenarios.
- The 05/20/22 bottom was Primary wave “4” of the secular bull market that began in March 2009. One or all of the three main US stock indices could make new all-time highs. The monthly momentum evidence illustrated in the 05/21/22 blog “Relentless Stock Market Decline” suggests new highs are a low probability.
- The 05/20/22 bottom was Primary wave “4” however Primary wave “5” fails make a new all-time high. This is called a truncated wave in which wave “five” fails to exceed the termination point of wave “three” typically truncated waves retrace between 90% and 99..9% of the prior move down/up.
- The DJI – Primary wave “5” top was made in January 2022 and a complex bear market similar to the DJI – 2000 to 2002 decline is underway. This is the most likely scenario. The current rally could retrace between 50 to 90% of the January to May 2022 decline.
Blogs next week will closely examine the powerful post 05/20/22 rally and possible termination points.
The next blog will look at the UK 100 stock index.
