On 02/18/22 the S&P 500 (SPX) decline to the edge of what could be important support.
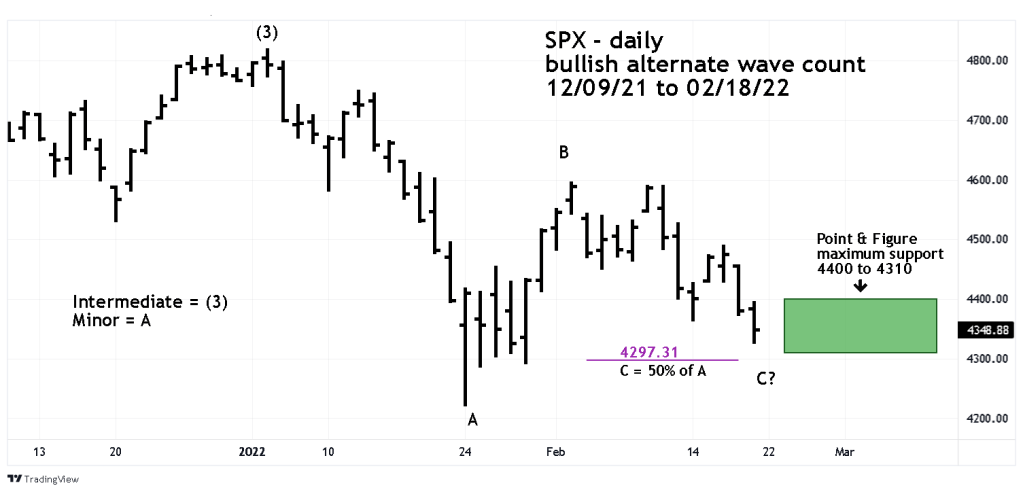
The daily SPX chart courtesy of Trading View illustrates a bullish Elliott wave count.
The 02/17/22 blog “Potential Stock Buying Opportunity on 02-18-22” noted that an Elliott wave – Horizontal Triangle may have been completed on 02/17/22. The key level was the SPX bottom at 4364.21. On 02/18/22 this bottom was breached and invalidated that particular Horizontal Triangle wave count. SPX 4364.21 was the presumed termination point of Minor wave “C’’ and wave “E”s” of Horizontal Triangles can not exceed the end point of wave “C.”
While that particular Horizontal Triangle pattern is invalidated its possible a Horizontal Triangle could still be forming with wave Minor wave “C” underway or possibly ended at the 02/18/22 bottom. The low on 02/18/22 was 4327.22 above the lower limit of Point & Figure support illustrated in the 02/14/22 blog “Bears Push Further into Support Zone.” The tradingview.com index of SPX500 was used to illustrate the Point & Figure chart, the corresponding lower support level for the SPX corresponds to approximately 4310.
Just below the lower support limit is a Fibonacci coordinate point at 4297.31 which is where the presumed Minor wave “C” is 50% of Minor wave “A,” this is a logical spot for Fibonacci support in a Horizontal Triangle pattern.
Sometimes in Point & Figure charts there can be marginal breaks of support/resistance levels that can become bull/bear traps. It’s possible a bear trap could be forming if the SPX beaks below 4310 and bottoms near or at 4297.
The next daily SPX chart illustrates one of the bearish alternate Elliott wave counts.

This is a lower probable wave count because of proportionality. The supposed Minute wave “ii” – boxed is larger in price and time than the supposed Minor wave “2”. Proportionality is an Elliott wave guideline, not a rule. While proportional differences such as in this case are rare, they cannot be eliminated as a possible wave count.
If this wave count is underway it implies are powerful drop could come soon, taking the SPX quickly down to the low 3800 area.
Current readings from the daily MACD and RSI are neutral. Only the Stochastic is hinting at a possible bottom with one of the lines in the oversold zone.
Traders were stopped out of half of a 50% long position when the SPX broke below 4364.21. The entry point was at or near the opening SPX price of 4384.57 a difference of .004 or four tenths of a percent. The loss on half of a half a position was insignificant.
Traders use a break below SPX 4290.00 as stop loss on the remaining half of the long position.
Trading is closed in the US on 02/21/22 for the Presidents day holiday. A bottom or a break of important support could be made on 02/22/22.
