The daily S&P 500 (SPX) chart courtesy of Trading View illustrates the long – term Elliott wave count and the next potential support zone.
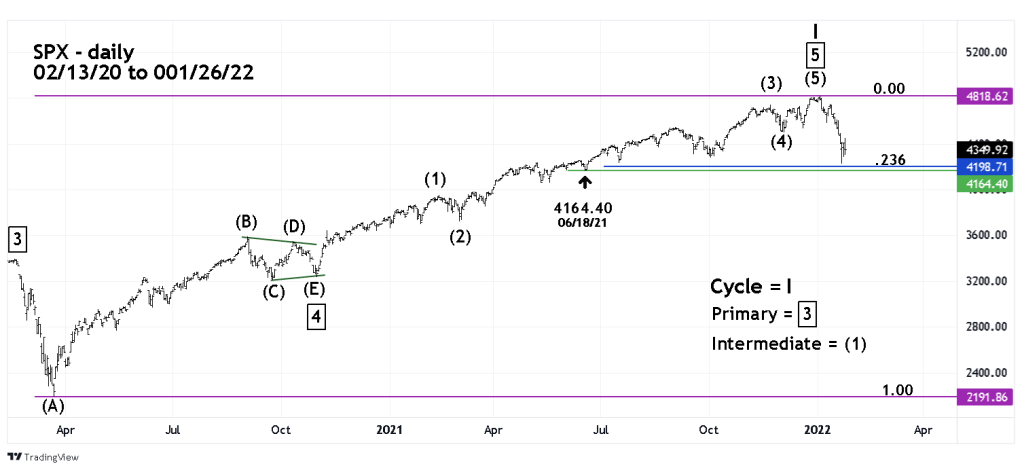
The Fibonacci .236 retrace level of the SPX bull market from the March 2020 bottom is at SPX 4198.71. Just below this is the bottom made on 06/18/21 at 4164.40. This support zone could create a bottom, after which a multi- day or multi-week rally may develop.
The hourly SPX chart provides short-term evidence that support the longer-term view.

Today’s post FOMC announcement rally peaked just above a .382 retrace of the decline since the 01/04/22 all-time high.
A potential bottom in the 4198 to 4164 zone could be made on 01/27/22 or 01/28/22.
