Occasionally markets could have a turn near a new year. The most logical reason for this phenomenon is to defer taxes on profits into the next year. Another factor could be if a market is approaching a support/resistance level just before or after a new year.
Some examples of turns at the cusp of a new year could give a preview of what may be coming for US stocks.
The daily chart of the S&P 500 (SPX) courtesy of Trading View illustrates the bullish move in January 1987.

From mid – 1984 to mid – 1986 US stocks had a huge bull move. This was followed by a 10% drop into late September 1986. The rally from September to December 1986 then had a correction to the .50 Fibonacci level that bottomed on the last trading day of 1986.
On the first trading day of 1987 the US stocks blasted upwards, and by March 1987 the SPX had gained 25% from the 12/31/86 bottom.
The next example illustrates the SPX short-term peak made in late 2015.
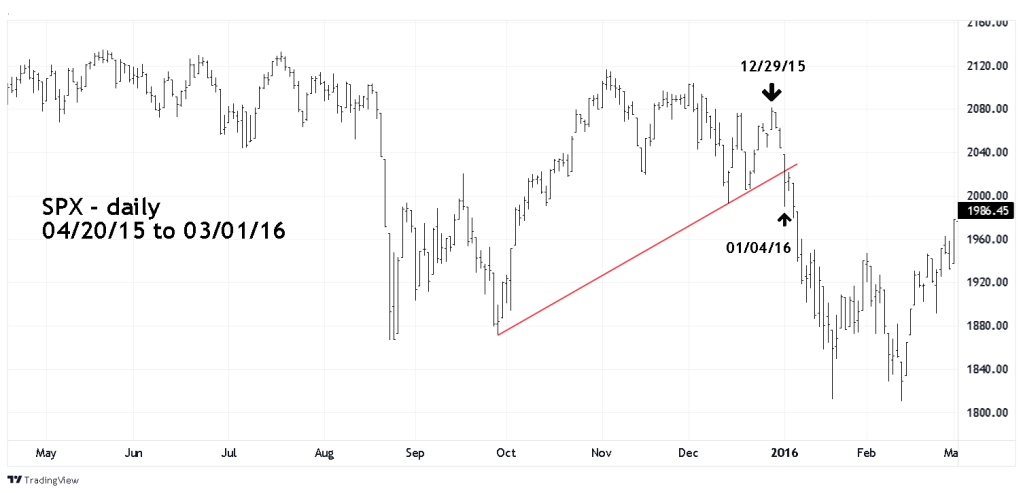
In May 2015 the SPX made an all-time. Price lingered near the top until August 2015 when there was a mini crash. The next rally moved to near the all-time high, then chopped lower. On 12/29/15 a short-term high was made. Then on the first trading day of 2016 the bears targeted and broke the rising trend line from the late September 2015 bottom. The break triggered another mini crash.
The most recent example of a near new year turn occurred in December 2018.
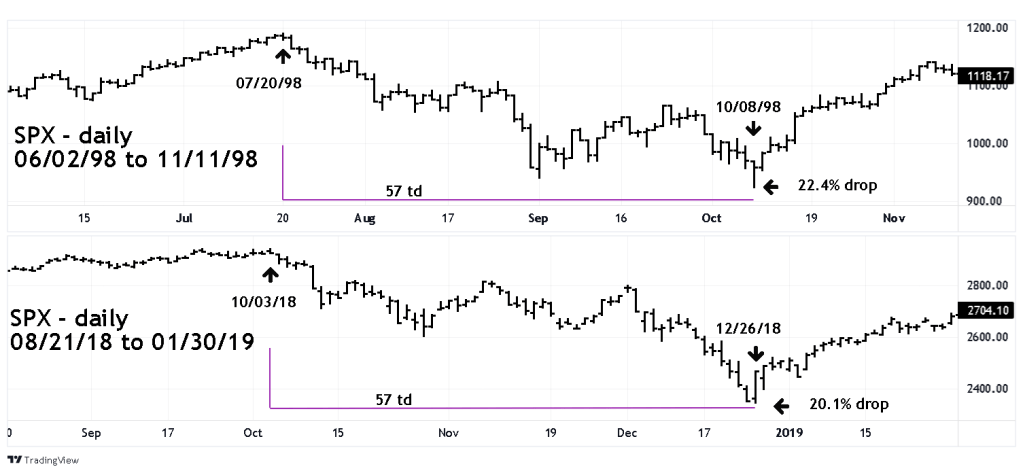
The SPX correction in late 2018 had an amazing analogy with the SPX correction in 1998. I made this discovery in December 2018 when it appeared the SPX could be heading for a 20% decline and possibly bottom near the end of 2018. I looked to see when the last time the SPX had a 20% correction and discovered that the drop in 1998 was similar in time and price to the late 2018 decline.
Please see my tradingview.com 12/23/18 post “Ghost of Bear Market Past” for additional information about this analogy discovery. My tradingview.com username is “ markrivest.”
The 2018 SPX drop matched the time of the 1998 decline and came close to matching the percentage drop.
Most importantly the 2018 decline was matching the time limits /price limits near the end of the year. After 12/26/18 the SPX by 05/02/19 had gained 25%.
Most of the time dynamic trend changes do not come on the cusp of a new year. It requires a combination of factors. In late 2021 there’s the factor of deferring taxes on gains into the next year. There’s also potential major Fibonacci resistance in the SPX 4840 to 4890 area.
If the SPX can soon reach the resistance zone it could be the prelude to at least a 10% drop and possibly a new bear market greater than 20%.
