The prior blog noted the S&P 500 (SPX) could be forming an Elliott wave – Horizontal Triangle correction which could be the prelude to a year end rally .
The SPX – 60 – minute chart courtesy of Trading View updates the progress of the presumed Horizontal Triangle.
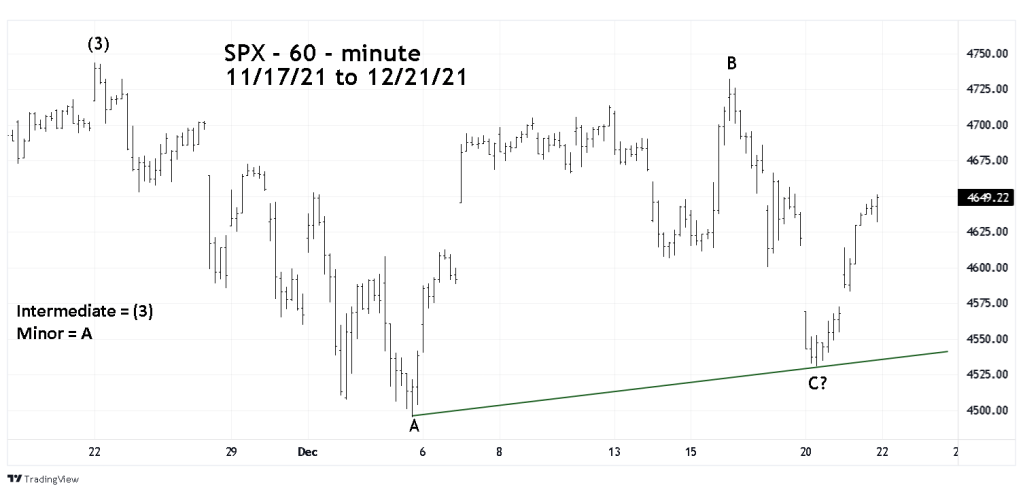
The supposed Minor wave “C” declined deeper than expected, and if complete was 80.7% the size of Minor wave “A.” Most of the time there are Fibonacci relationships between the alternate waves of a Horizontal Triangle. For example, wave “A” to “C.” While Minor wave “C” does not have a Fibonacci relationship with “A” , 80.7% is not a Fibonacci ratio. Wave “C” could have a subsequent relationship with Minor wave “E”
The time span of the supposed wave “C” was only 16- trading hours. Minor wave “A” lasted 58 – trading hours – a ratio of 16/58 = 27.5%. The decline was much briefer than what usually happens relative to wave “A” and lowers the probabilities that wave “C” is complete. Its possible the bottom made on 12/20/21 could soon be tested.
The SPX 3- minute chart reveals clues that a decline of at least 1 – trading day could develop.
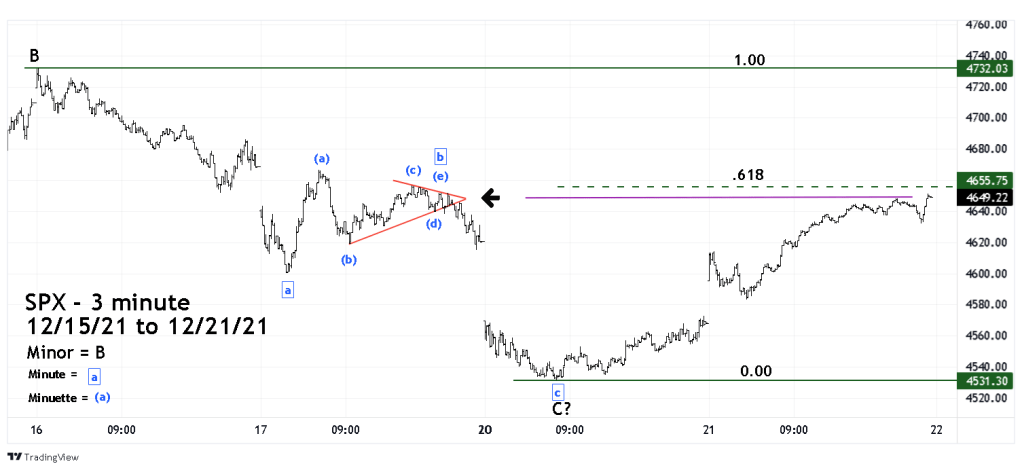
It appears that a Minute wave degree – Horizontal Triangle formed in the mid – section of the supposed Minor wave “C” – which is where a correction of the decline is likely to occur. The rally off the 12/20/21 bottom climbed into the apex of the Horizontal Triangle. This chart resistance is a logical area for the rally to halt.
Additionally, just above the apex is the Fibonacci .618 retrace of the 12/16/21 to 12/20/21 decline. These two factors present a formidable short-term barrier and implies the SPX could decline in the next one or two trading days.
A move below the 12/03/21 bottom in the next few trading days would eliminate the Horizontal Triangle wave count.
