First some clarification about the prior two blogs. In the “Three Possible Elliott Wave Count” post there were only two charts shown. The first chart illustrated two of the possible wave counts – the potential end of the Double Zigzag count and a possible continuation of the Double Zigzag. The second chart examined the possible Horizontal Triangle.
In the “Are Stock Bulls in Control?” blog I mistakenly stated the opening range of the S&P 500 (SPX). Opening range analysis is part of the” Market Profile” methodology which because of volume analysis make study of the S&P 500 – E-Mini futures the better index to use. On 10/07/21 the opening range of the December 2021 S&P 500 – E-Mini contract had no upside follow through, and near the end of the session tested the low of the opening range.
The Important US Payroll report can frequently trigger large moves in US stocks. As it turned out the report on 10/08/21 did not trigger a large move, with the SPX having a relatively narrow daily range. The action on 10/07/21 continues to look like an important clue to near-term action. On 10/07/21 the S&P – E-Mini futures tested the low of the opening range. On 10/08/21 S&P – E-Mini futures went below the 10/07/21 opening range. Considering the big upside open on 10/07/21 this additional downside move is another sign of weak bullish conviction.
The Nasdaq Composite (IXIC) decline since its all-time high on 09/07/21 has yielded some interesting Fibonacci and Elliott wave relationships. Before examining the short-term Elliott wave count, we need to see where it could fit in the larger picture.
The IXIC – daily chart courtesy of Trading View illustrates the long-term Elliott wave count.

The decline from the IXIC 09/07/21 all-time high could be Intermediate wave (4) of a developing Elliott extended Impulse wave up from the March 2020 bottom. Frequently there are Fibonacci relationships between waves “two” and “four.” The supposed Intermediate wave (2) was the largest correction of the bull move falling 12.87%. multiplied by the Fibonacci ratio of .618 yields 7.95%. The 09/07/21 to 10/04/21 decline was 7.93% bottoming at 14181.64 near the 07/19/21 correction low of 14178.66.
A case can be made based upon these coordinates that the Intermediate wave (4) bottom is in place. Other factors open the door for more downside action.
These factors are, October bearish seasonality, the 200- Moving Average (MA) “magnet” and short-term Elliott wave and Fibonacci analysis.
The 30- minute IXIC chart illustrates the short-term view.
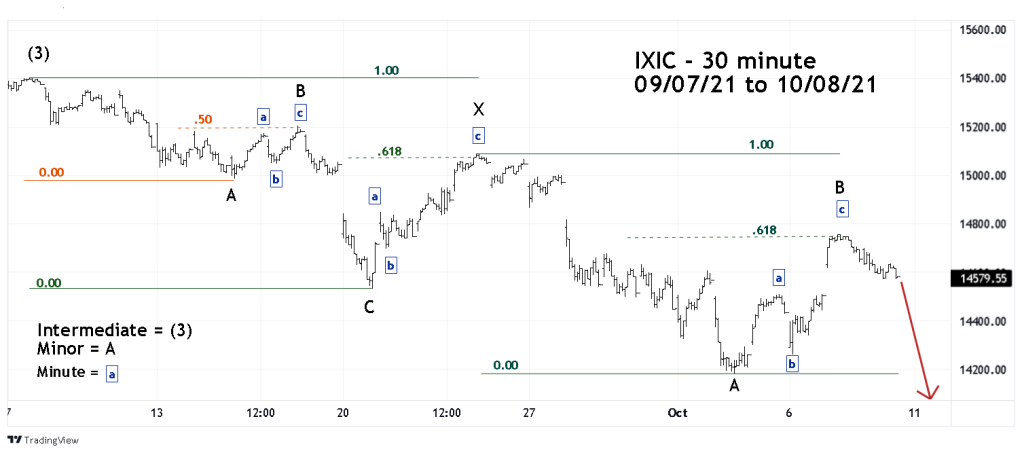
The decline since 09/07/22 appears to be a developing Double Zigzag. There are usually Fibonacci relationships within the sub waves of a Double Zigzag and this structure has several.
The first Minor wave “B” retraced .50 of the first Minor wave “A”.
Minor wave “X” retraced .618 of the first (A-B-C) Zigzag.
The second Minor wave “B” retraced .618 of the second Minor wave “A”.
The first Minor wave “B” is .382 of the second Minor wave “B”
The second Minor wave “B” is nearly equal to Minor wave “X.”
If there’s a second Minor wave “C” decline it could have a Fibonacci relationship with one or more of the other sub waves. If so, it could be helpful in discovering the termination point of the Double Zigzag formation.
Weak bullish conviction during a seasonally bearish time implies more downside action could be coming next week. If the IXIC and SPX – 200 – day MA’s are broken it could signal an important bottom. Continue holding short.
