The US stock market decline since early September continues struggle its way down.
The 60-minute S&P 500 (SPX) chart courtesy of Trading View illustrates two possible Elliott wave counts.
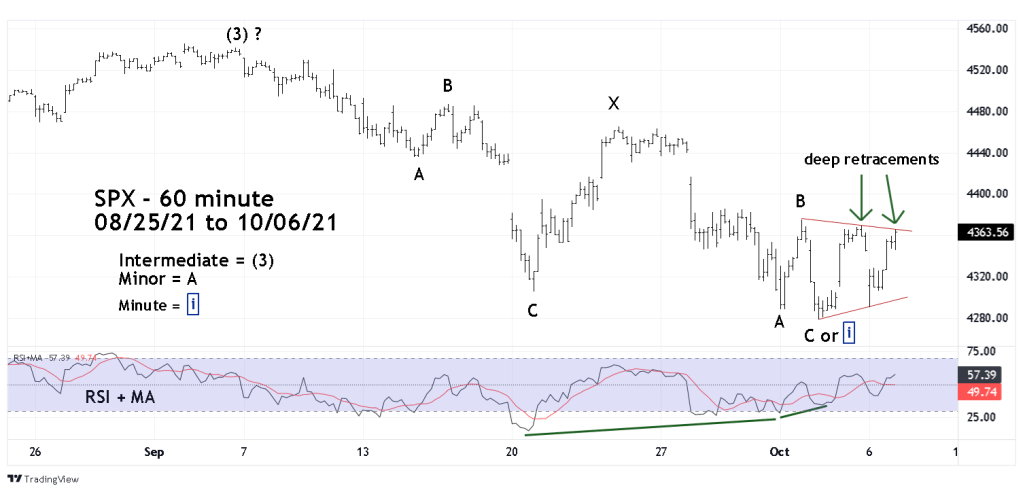
The 10/02/21 blog “Struggling to Go Lower – Part Two” noted that an Elliott wave Double Zigzag down was perhaps under development. The count shown in the 10/02/21 blog had the second wave “A” down complete, followed by a rally. The post wave “A” rally now appears to be a completed second wave “B” up. Subsequently the entire wave up was retraced and the SPX on 10/04/21 made a marginal new decline low.
This post wave “B” decline could be a completed second wave “C”. If so, the entire Double Zigzag correction could be complete and implies a rally to new SPX all-time highs may have begun. Note the double bullish 60 – minute RSI + MA divergence at the SPX 10/04/21 bottom.
Alternately the 10/01/21 to 10/04/21 could be just the first wave down of a still developing five wave “C”. The sharp rally after the 10/04/21 bottom could be Minute wave “ii” – boxed of Minor wave “C”.
The double bullish divergence and deep retracements of the two most recent declines are evidence that a correction bottom could be in place as of 10/04/21.
There’s also a third possible SPX Elliott wave count illustrated in the SPX 30- minute chart.

Its possible that the second Minor wave “B” up may have formed an Elliott wave – Horizontal Triangle. This structure is found in the fourth wave position of motive waves and in the wave “B” position of corrective patterns.
Usually, Horizontal Triangles have at least two Fibonacci relationships between the sub waves of the structure. This supposed Horizontal Triangle has no Fibonacci relationships among the sub waves which weakens its case.
Traders are short 150% non – leverage SPX related funds. Lower the stop loss on half of the position to a move above SPX 4369.23 which is a high point of the supposed Minute wave “d.” Lower the stop on the other half of the short position to a move above SPX 4465.40.
Note that as of this writing, after main trading hours, the S&P 500 – E Mini futures are trading above the supposed Minute wave “d” peak. Elliott wave theory measures movements of the mass mind. What happens in after-hours futures represent a small minority of traders and is not reflective of the mass mind. Frequently after – hours moves beyond Elliott wave limits are retraced before the next main session begins.
