On 08/20/21 the US stock market as measured by September S&P 500 E-Mini Futures contract (ESU2021) may have reached a maximum resistance area. If so, an important secondary top could be in place.
A key aspect of the ”Market Profile” method is discovery of support/resistance zones. This can be achieved by examining either price or volume clusters. The largest cluster areas, referred to as Point of Control (POC) are the maximum support/resistance zones. POC can be discover by examining each trading day or by viewing a fixed trading range.
The 30 – minute ESU2021 chart courtesy of Trading View illustrates a fixed range market profile.

This chart shows trading volume on a vertical axis with the highest volume bar corresponding to the most frequent price bars. The range of the volume profile is from the peak made on 08/16/21 to the bottom on 08/19/21.
On 08/20/21 ESU2021 reached the area of maximum volume resistance, implying a possible intermediate top.
Point and Figure charts are similar to the market profile method and can be used to help confirm potential support/resistance zones.
Point and figure charting does not plot price against time as time-based charts do. Instead, it plots price against changes in direction by plotting a column of X’s as the price rises and a column of O’s as the price falls.
Because P&F charts compress price action, smaller time frames are needed to discover potential areas of support/resistance.
The 5 – minute ESU2021 chart illustrates action since 08/01/21.

The P&F maximum price cluster corresponds to the POC chart.
Stochastic is one of the more sensitive price oscillator indicators and can frequently give early hints of a potential trend change. Sixty – minute Stochastic is good for discovering intermediate size trend changes.
The 60- minute ESU2021 chart illustrates Stochastic action.
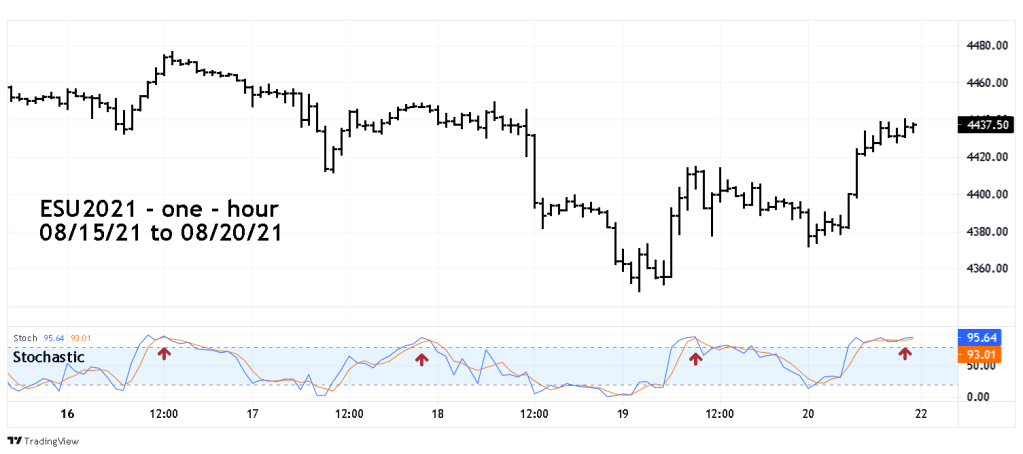
Late in the 08/20/21 session ESU2021 60- minute Stochastic reached the level which corresponds with the prior three intermediate peaks and implies at least a near-term top.
An ESU2021 move above the resistance zone opens the door for a move back to at least the 08/16/21 all-time high. A move down opens the door for a retest of the 08/19/21 bottom.
