The momentum of stock markets can be examined by external indicators that measure price. Some of the external momentum indicators are Stochastic and RSI. Internal momentum indicators measure components of stock indices, such as Advanced/Decline lines and 52 – week Highs/Lows.
The 06/28/21 blog examined recent deterioration of new – 52 – week highs for the S&P 500 (SPX) and Nasdaq Composite (IXIC).
Today’s blog 06/29/21 will examine what was happening underneath the surface during the 2015 SPX topping process. The daily SPX chart 2014 to 2016 courtesy of Trading View illustrates the key points of the 2015 top.

The SPX ultimate price high occurred 05/20/15. After a small drop, price surged back and on 07/20/15 was just below the prior high. Almost one month later price was only marginally lower. For traders focusing only on the price dimension – their conclusion probably would have been that a base was forming prior to a move to new highs. The action underneath the surface suggested something else.
The daily chart of NYSE New – 52 – Week Highs ($NYHGH) courtesy of StockCharts.com illustrates what happen 2014 to 2015.
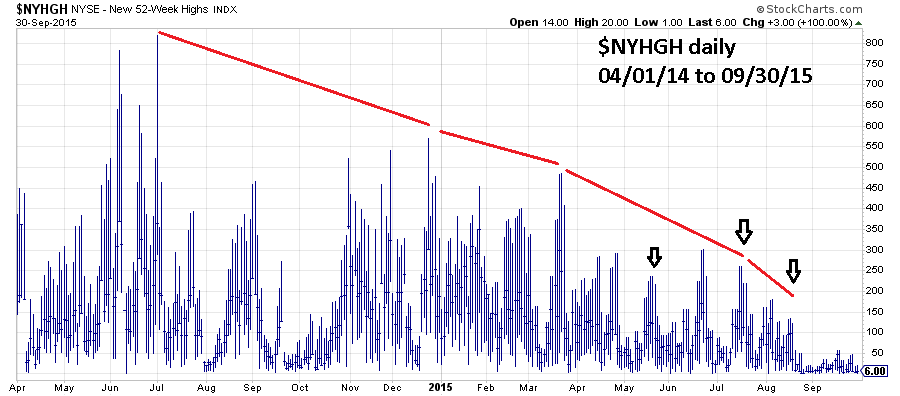
Prior to the SPX 05/20/15 peak there was a significant reduction in new highs. In June and July 2015 new highs increase relative to the 05/20/15 top. This small increase could have been a clue to a developing new price high. However, after 07/20/15 new highs continued to shrink and compared to the one- year deterioration – were at a shockingly bearish level.
The result was a mini crash.
The Bullish Percent Index is a breadth indicator based on the number of stocks on Point & Figure Buy Signals within an index. This is a good indicator to confirm internal weakness at stock market peaks. There are usually several bearish divergences before an index declines.
The daily SPX Bullish Percent Index ($BPSPX) illustrates its action 2014 to 2015.
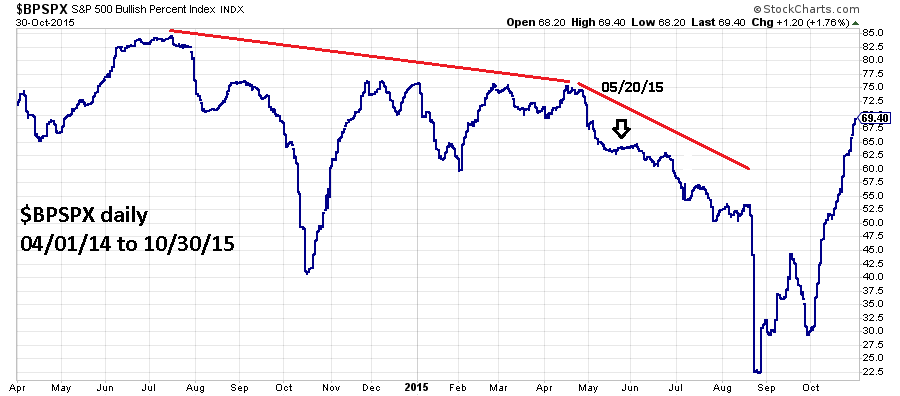
After 05/20/15 $BPSPX continued lower and was an important clue that the small increase in new highs may not have been bullish.
The daily 2020 to 2021 $BPSPX chart shows its recent activity.

The SPX is now above its late April level while $BPSPX has a significant double bearish divergence.
Today 06/29/21 both SPX and IXIC made new all-time highs and is short-term bullish. Keep watching the internal momentum indicators, if they continue to decline it could be the prelude of a sharp US stock market drop.
