Stock markets are ruled by the forces of optimism and pessimism, some would say hope and fear. Pessimism/fear is more intense which is why stocks and stock markets generally fall faster than they rise. Intensity also creates distinctive bottoms, the March 23, 2020, bottom is a perfect example, the vast majority of US stock indices bottomed that day. Tops generally are more spread out because hope is more diffused than fear.
What’s happing in 2021 for the US stock market could be unique. Several prior blogs on this site have noted the blow off top nature going into early May 2021. Yet in nearly a month the three main US stock indices have barely moved down from their respective all-time highs. Is the recent action a broadening top, or a base for the next wave higher?
An examination of a broad stock market top and two current speculative stocks give an interesting perspective on current US stock market action.
The daily S&P 500 (SPX) chart courtesy of Trading View illustrates the broad 2015 top.
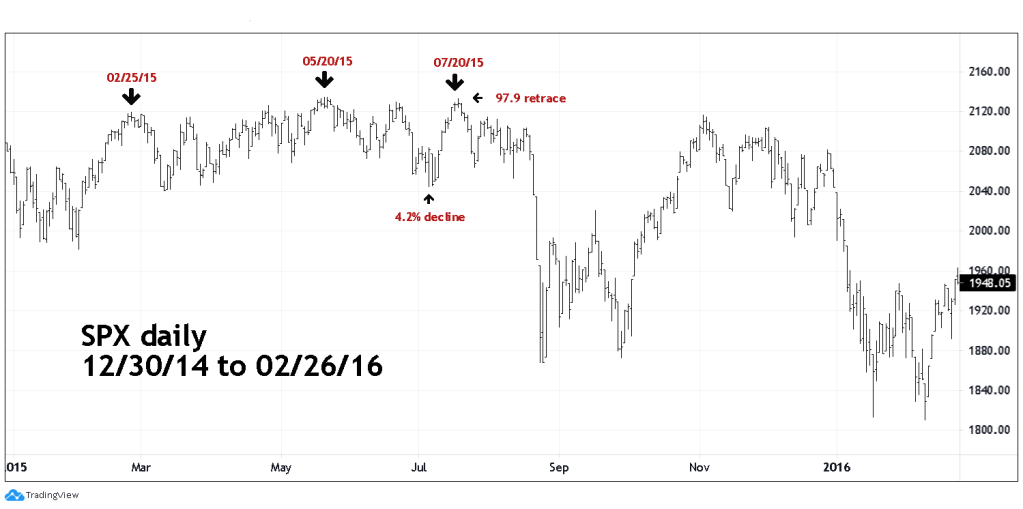
That peak took five months to develop, frustrating both bulls and bears. After the ultimate price high on May 20, 2015, the SPX declined 4.2%. the rally after that bottom retraced 97.9% of the decline. The drop after the recent SPX top on May 7, 2021, was 4.3%. and so far, the retracement has been 97.8%. The July 20, 2015, high corresponded with the Nasdaq Composite making a new all-time high – the only one of the three main US stock indices and was a “rule of the majority” sell signal. Soon after the July 2015 peak there was a worldwide mini crash.
The February, May, July SPX triple top was an anomaly. Normally in stocks and stock indices triple tops are the area where bears have stop buy orders. Most of the time bulls stage successful runs at those stop orders. Not in 2015, this time the bears won the battle.
The probable 2021 stock market top is different than 2015 because of manic buying – in heavily shorted stocks.
The daily chart of GameStop Corporation (GME) illustrates the phenomenon.
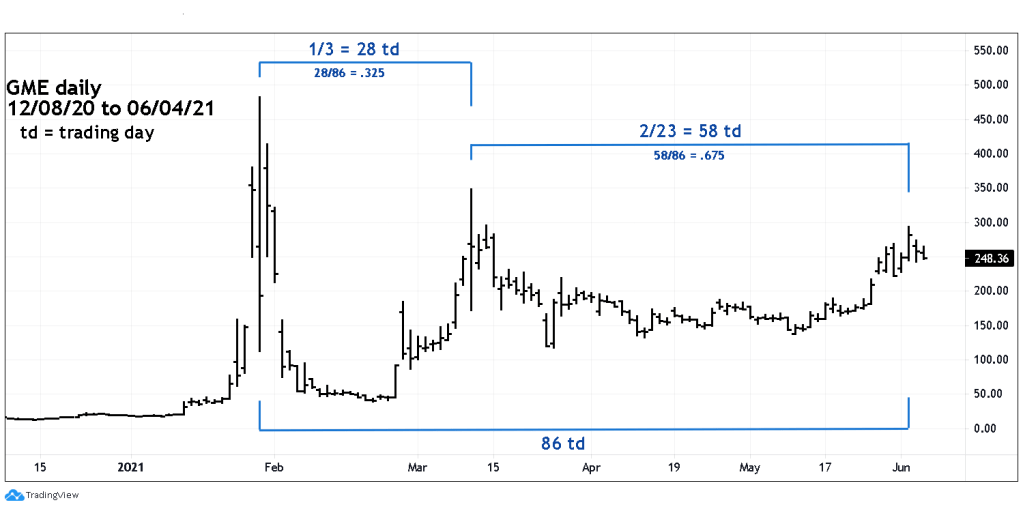
The massive GME move up in January 2021 was caused by a large group of individual traders successfully triggering a short squeeze. This is a relatively new event because short squeezes are normally initiated by large funds.
Manic buying does not create a bull market, it’s a symptom of an extended bull run. Fear dissipates as a market climbs higher, drawing in novice players that would normally be frightened to enter a market. The advent of individuals ganging up on heavily shorted stocks is a perfect example of this phenomenon. Most of the new players are probably low information traders and are buying stocks that have extended price rises. Some of the nimble traders may have sold near the late January peak. It’s a good guess many traders lost big on the subsequent decline which wiped out most of the gains in only five trading days!
Amazingly after the February collapse, two successive manias developed. The March bull run was weaker than the January rally and so far, the climb into June is weaker than March.
A fascinating Fibonacci time cycle could be occurring. The March peak is the time nexus for the January and June tops. Perhaps June 2, 2021, marks the completion of the GME mania.
The daily chart of AMC Entertainment Holdings, Inc. (AMC) shows that the buying mania has yet to be exhausted.

AMC is the most recent example of a manic short squeeze, and it could continue rising.
If US stocks are making a major top in 2021 it appears to have the characteristics of both a blow off peak and a broad top. This broad top phase may not last the five months it took in 2015. Perhaps only one month?
The phenomenon of stocks gaining 100%, 200% and even 500% in just a few weeks does not happen at the beginning of a bull market. It does not happen in the middle of a bull market. It only happens at the end of a bull market, and there’s decades of history to prove that fact.
The recent narrow range of trading for most US stocks has been frustrating for both bulls and bears. Soon the bulls could be experiencing more than just frustration.
