The first phase or kick off of the S&P 500 (SPX) secular bull market was from 03/06/09 to 04/26/10. This move lasted 286 trading days and gained 82.9. This was one of the farthest and fastest rallies in US stock market history.
The bull phase that began on 03/23/20 to today – 04/16/21 has lasted 269 trading days and gained 91.2% even farther and faster than the 2009 to 2010 phase. If the current rally were to match 2009 to 2010 in time it would terminate on 05/11/21. The speed and gain of the 2020 to 2021 rally is incredible!
Could the 2020 to 2021 move be the beginning of a new secular bull market? Highly unlikely, my 04/10/21 blog “Market Resting Time” noted that the bear move prior to the 2020 to 2021 rally was too small to generate a secular bull market. The bull phase that began in March 2020 is most likely the termination phase of the secular bull market, more specifically – a blow off top.
Blow off tops usually happen in commodity markets and individual stocks. There’re rare in stock indices. The daily SPX chart from 2017 to 2018 courtesy of BigCharts.com illustrates the last one to occur in the US stock market.
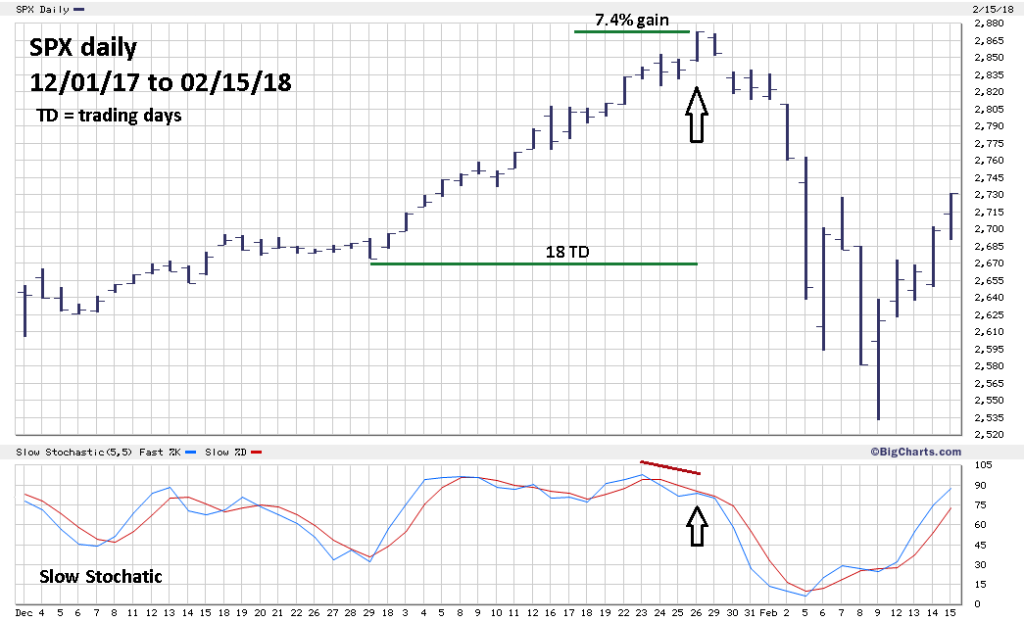
The blow off phase of a relentless 2017 SPX rally began on 12/29/17 and gained 7.4% in 18 trading days. Note at the very top a small Slow Stochastic bearish divergence coming after a bearish crossover.
Now examine the powerful April 2021 SPX rally.

This rally began on 03/25/21 and has gained 8.7% in 15 trading days. Faster and farther than the 2017 to 2018 blow off top. Also note the small Slow Stochastic bearish divergence coming after a bearish crossover.
Today both the SPX and Dow Jones Industrial Average made new all-time highs – a bullish “Rule of the majority” signal. These signals can occur at major, intermediate and minor US stock market turns. The signal does not happen when there’s a powerful move up or down. At the January 2018 blow off termination day – 01/26/18 the SPX, Dow Jones Industrial Average and Nasdaq Composite all made new all-time highs. If a blow off top is underway, today’s signal is likely false.
A 50% short position of non-leveraged related SPX funds was initiated at the open of SPX trading 04/12/21. A move above SPX 4190 was the first stop loss level for half the position. This was triggered late in the 04/16/21 SPX session. The total move from the 04/12/21 open was 1.6% the loss on half of the 50% position was 0.4% Continue holding short the remaining position maintain the stop loss on a move above SPX 4210.00.
The action after the 2018 blow off top was a 12% – 10 trading day micro crash, there’s a good chance something similar could happen after the current rally. What we’re witnessing in the US stock markets is stunning and rare. You may think the rally will never end; it will end at some point. This could occur very soon or may already have happened.

I’m beginning to think you really can’t fight the Fed. Maybe the only way this relentless bull ends is if inflation gets out of control and the fed has to raise rates.
LikeLike
Thanks for the comment. You’re correct at some point the Fed will probably have to raise rates, stock markets look ahead. Whenever the decline begins the market does not need news or any particular reason. I’m sure the news media will come up with a reason for the decline, maybe they’ll guess correctly. My guess is that the real reason for a multi month decline may not be known until about half way through the drop.
LikeLike