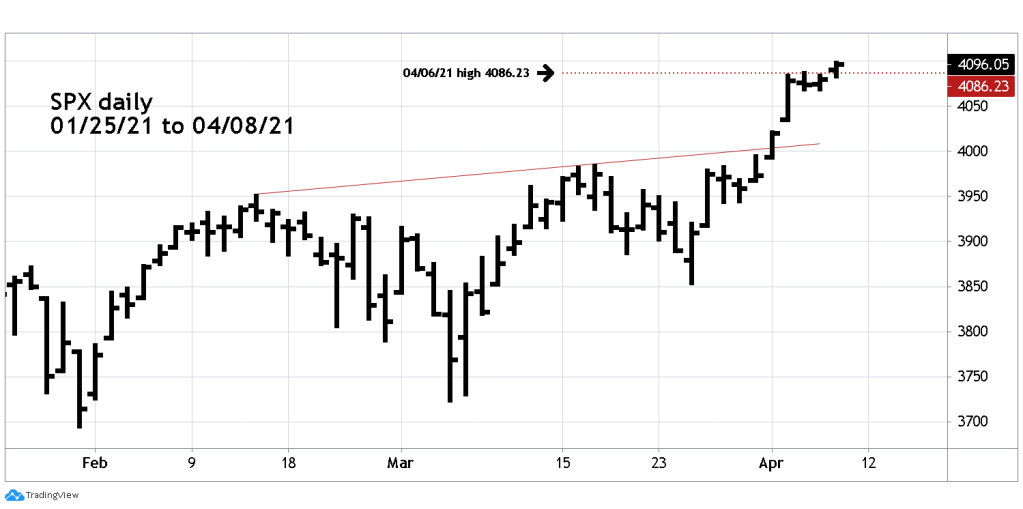
On 04/06/21 the supposed S&P 500 (SPX) – Ending Diagonal Triangle (EDT) throwover was at an extreme. The 04/06/21 blog “The Cherry on Top” noted “ If the rally into the high of the day was a completed EDT there’s a high probability the SPX could trend down throughout most of 04/07/21”. This didn’t happen, the SPX declined a little and ended the session above its opening price. Today the SPX opened above the supposed EDT high, invalidating the short-term Elliott wave count illustrated in the 04/06/21 blog and invalidated the supposed EDT pattern that began on 01/29/21.
Immediately after todays open the SPX rose above the second stop loss level for the short trade recommended at the SPX 04/01/21 open. The move up from the SPX open on 04/01/21 to the stop level at 4090.00 was 2.40% resulting in a loss for the 50% position of 1.20%. The total loss from the trade initiated on 04/01/21 was 2.00%.
There are always alternate Elliott wave counts, today’s activity means another wave count is in effect. Could this mean the current rally continues for several months? Anything is possible, but this scenario is highly unlikely. The vast amount of evidence from the sentiment and momentum indicators suggests a major stock market top is forming.
The current and relentless rally could terminate in a few weeks or sooner. I have a theory of what Elliott wave count could be in happening and an upside target. The trading action on 04/09/21 is needed before presenting this theory.
The risk/reward ratio to go long is not favorable, traders should remain flat. The next big move for US stocks is most likely to be down. Be patient, wait for a favorable shorting risk/reward situation.