Today 04/06/21 the S&P 500 (SPX) made new all-time high unconfirmed by the Dow Jones Industrial Average, and the Nasdaq Composite. A bearish “Rule of the Majority” signal.
What happened on the intraday chart from an Elliott wave perspective was fascinating. The best Elliott wave count for the SPX has an Ending Diagonal Triangle (EDT) forming from the 01/29/21 bottom.
The SPX 15 – minute chart courtesy of Trading View illustrates the progress from the supposed Minor wave “3”.

Each of the five waves of an EDT subdivide into three-wave patterns. The supposed Minor wave “4” is a clear three waves. Minute waves “a” and “c” are separated by a Horizontal Triangle – Minute wave “b”. The subsequent powerful rally which I refer to as a buying panic was a clear impulse pattern. Note that the final portion of Minute wave “c” had a significant RSI bearish divergence.
The following SPX 1 – minute chart shows something amazing.
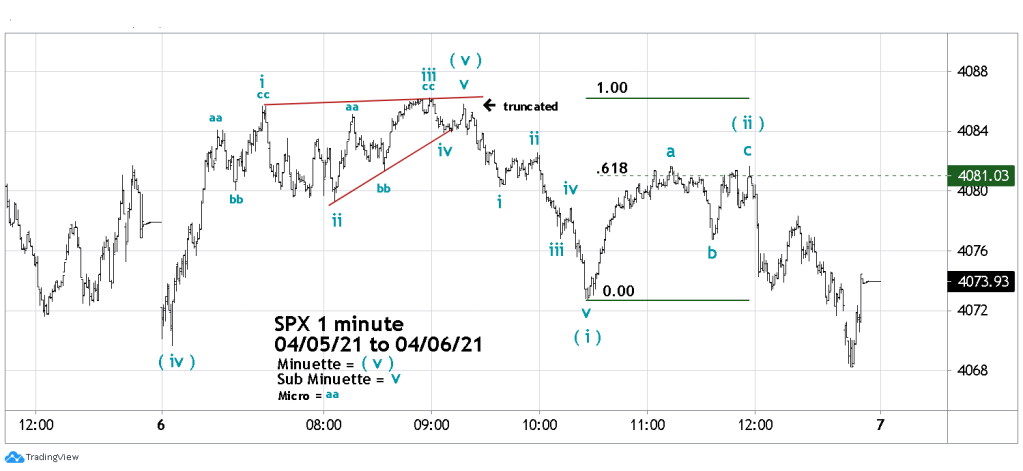
As I monitored the intraday action of the SPX, I noted the rally from the low of the day had taken the form of a double three. I instantly realize that a small-scale EDT could be forming. Considering the powerful rally that occurred over the prior two trading days this is what could be expected. R.N Elliott said EDTs appear after the market has moved “too far too fast”.
After the SPX high of the day labeled Sub Minuette wave “iii” there was a small decline and I waited for another rally to peak marginally above Sub Minuette wave “iii”. After a small drop the SPX climbed but failed to exceed the high of the day. The next decline was too deep to be an ongoing Sub Minuette wave “iv”. Then I thought Sub Minuette “v” may have been a Truncated fifth wave! If so, the developing decline needed to subdivide into five -waves, which it did. If this five – wave decline was the first wave down of a larger drop, the next rally should be in three-waves and retrace about .618 of the drop. Again confirmation!
The last hour decline went below the EDT point of origin at 4069.61. If the rally into the high of the day was a completed EDT there’s a high probability the SPX could trend down throughout most of 04/07/21.
Rising Ending Diagonal Triangles are a very bearish signal. Truncated fifth wave are a very bearish signal. Combined they are a super bearish signal. Additionally, today’s EDT is completing the larger daily EDT pattern. Incredible!
If this pattern is correct its like the cherry on top of an ice cream sundae. This final small EDT could be the top of not only the rally from 01/29/21,but also the pattern from 03/23/20 and possibly completion of the secular bull market since March 2009.

Wow. Fascinating. And yet, after so many months of steady-climbing, I have to say that I find it hard to believe that a top to this crazy mountain may ever be found.
Sent from my iPhone
LikeLike
That’s what a major top is like.
LikeLike
Hi,
I’ve just seen ES Mini reached 4090, so it reaches your stop-loss for 50% left?
LikeLike
The stop loss is based on the S&P 500(SPX) not the ES Mini Futures. If the SPX opens above 4090 on 4/8/21 – 9:30 AM -ET close out short positions. If the SPX opens below 4090 close out short positions on a move above 4090.
LikeLike