Toady 3/30/21 the S&P 500 (SPX) had a shallow decline. More importantly, the Russell 2000 (RUT) was up for most of the day. Recently RUT has been lagging the SPX.
The daily RUT and SPX chart courtesy of Trading View illustrates the recent action between the two indices.
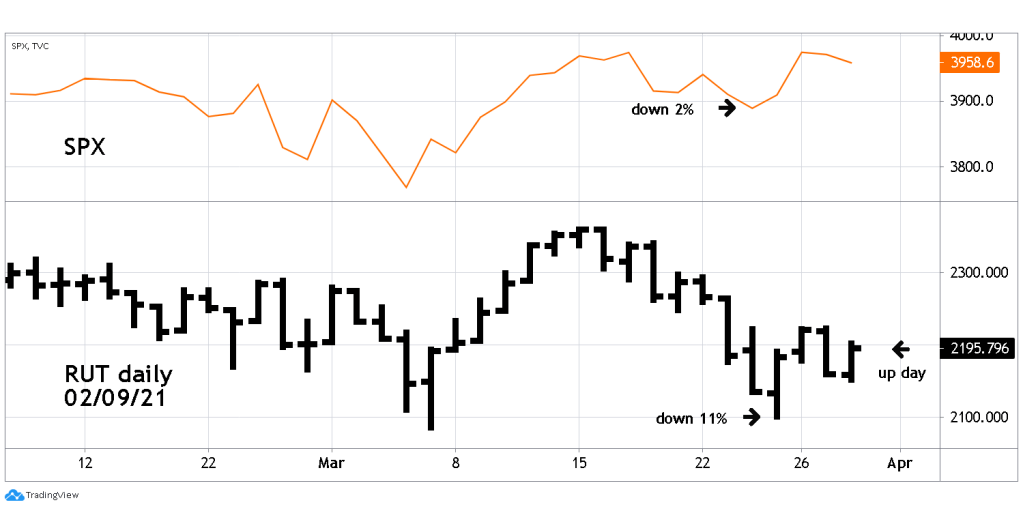
RUT’s most recent correction was down about 11% vs. the SPX 2% drop. With RUT’S move up today it’s doubtful a larger decline has started.
This situation could soon change. It appears the SPX is still the process of forming an Ending Diagonal Triangle. This pattern could be complete in one or two trading days.

Awwesome blog you have here
LikeLike
Thanks for the compliment.
LikeLike