On the 03/12/21 open of the S&P – 500 (SPX) trading session traders exited a 25% short position. The trade began on the SPX open 01/07/21 at 3764.71, the exit price was 3924.52 resulting in a loss of 4.20% of the 25% position. This contributes a 1.05% loss (4.20 x.25 = 1.05) to the running total detailed in the Trading Record section of this site.
On 03/11/21 the SPX move to new highs resulted in a change of the Elliott wave count.
The daily SPX chart courtesy of Trading View illustrates the new wave count.
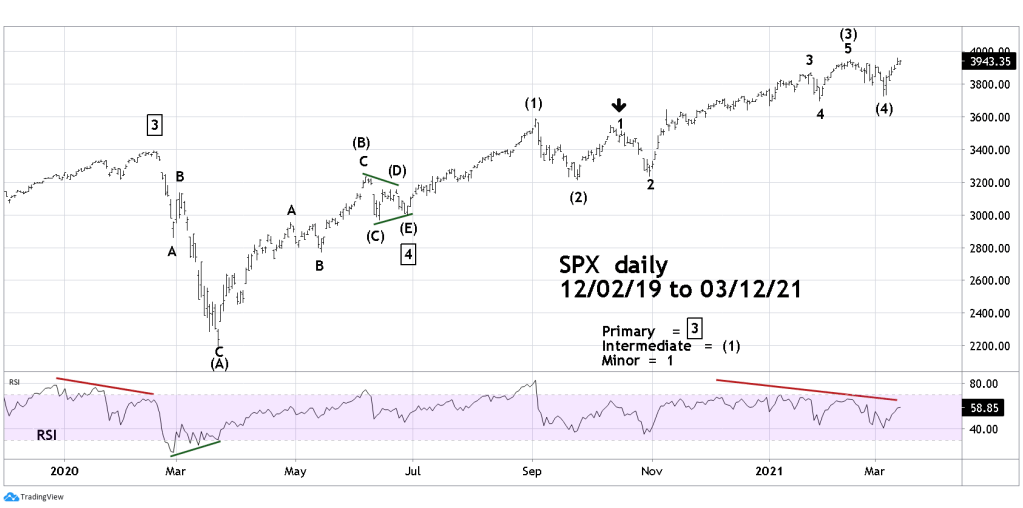
Previously the 10/30/20 SPX bottom counted as the supposed termination point for Primary wave “4”, the revised wave count has the 06/29/20 bottom as the Primary wave “4” termination point. This level was an alternate possibility, but the 09/02/20 to 10/30/20 correction was larger than the 06/08/20 to 06/29/20 correction. When counting waves proportionality is an important factor in determining the correct wave count. In the movement up from the March 2020 bottom, the September to October drop had the most likely proportional size as the end point of the Horizontal Triangle (waves (A) – (B) –(C) –(D) – (E) ).
If the revised wave count is correct, its an example of how sometimes a smaller proportional market movement can provide the answer to an overall pattern configuration.
One other factor in the revised count needs to be highlighted. Note the arrow above the Minor wave “1” label. This is not a slightly misplaced label, it’s the high point made on 10/16/20. When labeling waves, it’s important to determine if the sub waves agree with the larger wave count. The hourly chart of the movement 09/24/20 to 10/12/20 reveals it’s a three-wave rally. The supposed fifth wave of this movement appears to be truncated, meaning it did not exceed the termination point of the supposed wave three.
Truncated fifth waves appear roughly about 10 to 15% of the time, and make wave counting more difficult. Many times, they’re not discovered until well after the fact and they increase the number of alternate wave counts.
The revised count, because of proportionality and possible truncation means its not an ideal Elliott wave pattern. It would be nice to always get textbook patterns, the markets are not so generous. This is why its important to view all four market dimensions, price, time, momentum, and sentiment.
Note the multiple bearish divergences of the RSI. The situation is remarkably similar to the last significant peak in February 2020. The US stock market could be on the verge of an important move down. The next post will examine the intraday wave count of the Dow Jones Industrial Average and a fascinating time cycle that could be in play.
