Toady 03/09/21 the Dow Jones Industrial Average (DJI) made a new all-time high unconfirmed by the other two main US stock indices S&P – 500 (SPX) and Nasdaq Composite (IXIC). This is what I call a “Rule of the majority” signal and is an indication of weaking upside momentum, a healthy rally would have all three main indices or at least two making new highs. This is the second “Rule of the majority” signal, the first coming on 02/24/21 when the DJI made a new high unaccompanied by the SPX and IXIC.
The 30 – minute chart courtesy of Trading View illustrates the DJI action since 02/09/21.
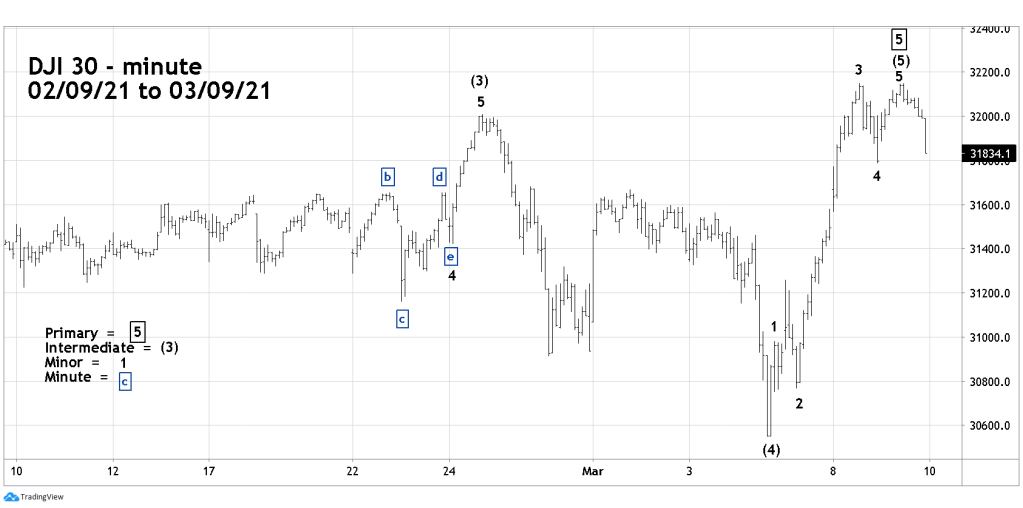
Note the sharp angle of the supposed Intermediate wave (5). This sharp and fast move is characteristic of fifth wave spikes. Also note the clear subdivision of the five Minor waves.
The decline of the Nasdaq – 100 (NDX) from its 02/16/21 all-time high continues to look like a developing impulse wave down.
The 30 – minute chart illustrates the smooth steady decline since 02/16/21.

My prior blog noted that the rally from the NDX bottom at 12208.40 may have been an Elliott fourth wave. Since then, the NDX has crossed over into the area of the supposed Minuette wave (i) which invalidates the standard impulse wave count. Its possible a Leading Diagonal Triangle could be forming. In that pattern wave “four” can cross into the area of wave “one”. However, this pattern requires converging trendlines from the sub wave termination points. This decline is moving between a parallel channel.
The two most likely alternate counts are that a Single Zigzag has formed (a-b-c). The other, and most likely wave count is that a series of “ones” and “twos” down is forming, if so, this has very bearish implications.
A major clue that this could be the correct count comes from where the NDX rally today terminated. A .382 retrace of the decline from the 02/16/21 top is at 12846.80. A .618 retrace of the decline from 13301.60 targets 12884.00. The NDX high point today came at 12868.50 between the two Fibonacci coordinates. Typically, when two or more Fibonacci coordinates are close together it represents powerful support/resistance. A significant move above 12884.00 could put this wave count in doubt.
If within the next few trading days NDX breaks below its bottom at 12208.40, it could trigger an extremely fast and deep decline.
On 03/09/21 the DJI made a new all-time high unaccompanied by the other two main US stock indices. The NDX turned down from two Fibonacci coordinates. These two factors are additional evidence a significate top for US stocks could be in place.
Traders are holding 25% short non-leveraged SPX related funds from the 01/07/21 open. Continue holding short.

Hi Mark,
As you wrote “A significant move above 12884.00 could put this wave count in doubt”, so the strong move above 12884 happened on March 10th can be the signal that the overall decline is in doubt?
Hope you well 🙂
LikeLike
Hi Hung
Great question. The vast majority of the time when a market moves beyond two Fibonacci points that are close together the subsequent break through is powerful. That’s what I was expecting when I wrote the “in doubt” comment. What happened is rare, the break through was only marginal and then the NDX went down for the balance of the day. Based upon that factor the wave count for the NDX I posted on 3/9/21 is still in effect. I think a series of ones and twos down is forming and a break below the NDX most recent bottom could trigger a very strong and fast decline.
Mark
LikeLike