Today 03/04/21 the S&P 500 (SPX) broke below the rising trendline from the bottoms made on 03/23/20 and 10/30/20. Additionally, the short- term bottom at 3789.54 made on 02/26/21 was also broken. These dual breaches of support contribute to the massive amount of evidence that US stocks may have formed an important top.
The daily SPX chart courtesy of Trading View illustrates its current situation.
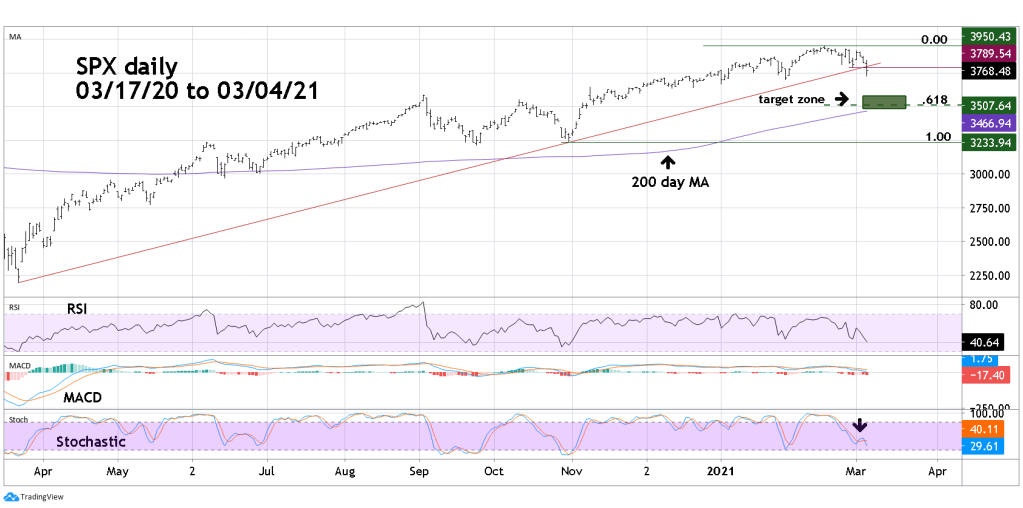
Near-term momentum indicators are bearish. The daily RSI is at 40%, the oversold zone begins at 25%, this implies SPX price could decline for several trading days. Both lines of daily MACD have yet to go below the zero line, this also suggests SPX could trend lower. Today’s daily Stochastic had another bearish line crossover and has yet to reach the oversold zone.
The next important downside target is the 01/29/21 bottom at 3694.12 a break below that support could open the door for a move down to the rising 200 day Moving Average (MA) . A Fibonacci .618 retrace of the bull move from 10/30/20 to 02/16/21 is just above the 200-day MA. The area around this retracement level is a logical place for at least a short-term bottom.
Traders are holding 25% short non-leveraged SPX related funds as of the open on 01/07/21. Continue holding short.

Wow, Mark! That’s interesting news. Thanks for this latest information. Keep up the excellent work!
LikeLike
Thanks
LikeLike