Elliott wave theory shows progress of the mass mind and can be charted on any time scale. A chart spanning decades can have the same basic form as a chart limited to a few hours. Frequently intraday patterns can aid in clarifying a larger trend.
The Nasdaq 100 (NDX) – 15 – minute chart courtesy of Trading View illustrates its intraday action.
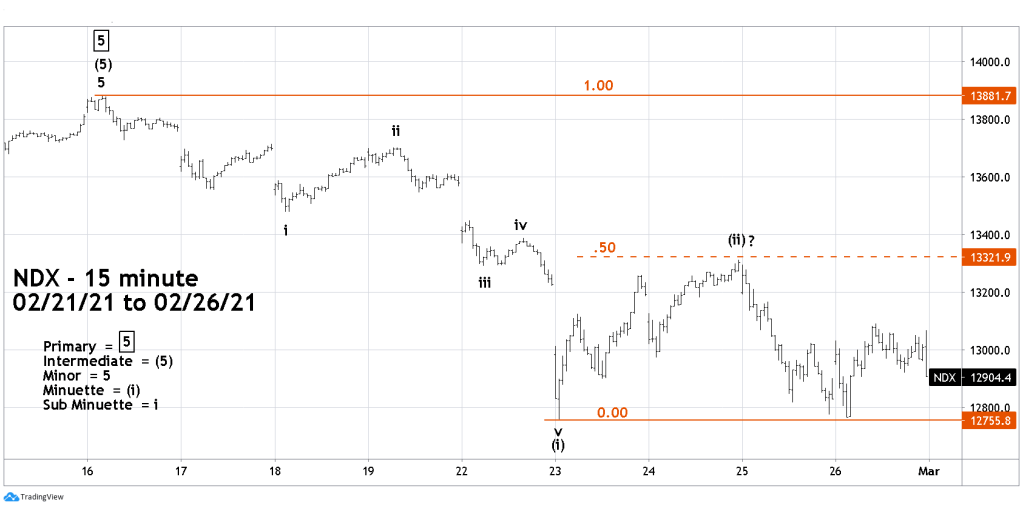
From the all-time high made on 02/16/21 NDX appears to have completed a five-wave Elliott impulse pattern. If correct it could be the first wave down of a larger developing five-wave pattern.
Normally two of the three motive waves within an impulse pattern will tend towards equality. In this case its waves one and three, with wave three being slightly larger. Wave “i” is also close to a 1.618 relationship to wave “v”.
The rally off the 02/23/21 bottom is choppy, a characteristic of corrective patterns and appears to be a Double Zigzag. The rally has retraced close to a Fibonacci 50% of the prior decline and stopped in the area of the supposed Sub Minuette wave “iv” – a logical resistance area.
So far NDX has a much clearer Elliott wave count than the S&P 500 (SPX), which from 02/16/21 to 02/26/21 has a very choppy pattern. As of 02/26/21 SPX looks more like a corrective pattern of the recent uptrend. An SPX move below its 02/26/21 bottom would imply something more bearish developing.
The Nasdaq Composite and Dow Jones Industrial Average also have dubious patterns from their respective all-time highs. The NDX intraday pattern offers the clearest roadmap. A break below its 02/23/21 bottom could be the early part of a third – wave down and likely to have bearish consequences for the broader US stock market.
Traders are short 25% non-leveraged SPX related funds since the open of trading on 01/07/21. Continue holding short.
