The rally in US stocks since the crash bottom of March 2020 is the strongest since the kickoff of the secular bull market began in March 2009. In Elliott Wave Theory wave “one” of a five-wave impulse pattern usually has a relationship to wave “five”. The most common relationship is equality in price and time.
The template for the action since March 2020 is illustrated in the daily S&P 500 (SPX) 2009 to 2012 chart – courtesy of Trading View.
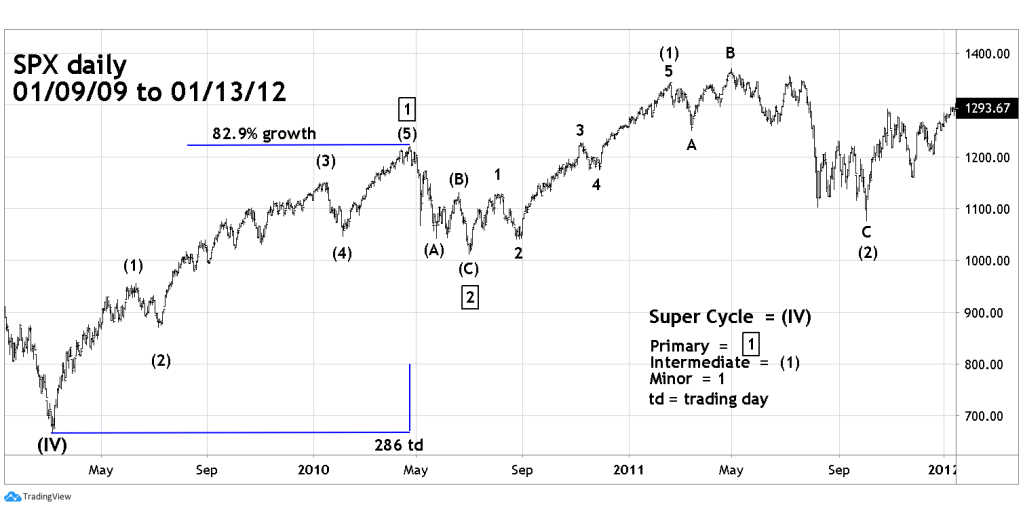
The SPX rally from March 2009 to April 2010 had a growth rate of 82.9% in 286 trading days. This was the most dynamic rally in price/time since the Dow Jones Industrial Average bull market in the 1930’s, which was the kickoff for the mega bull market 1932 to 1966.
The daily SPX chart from February 2020 shows the comparison to 2009-2010.
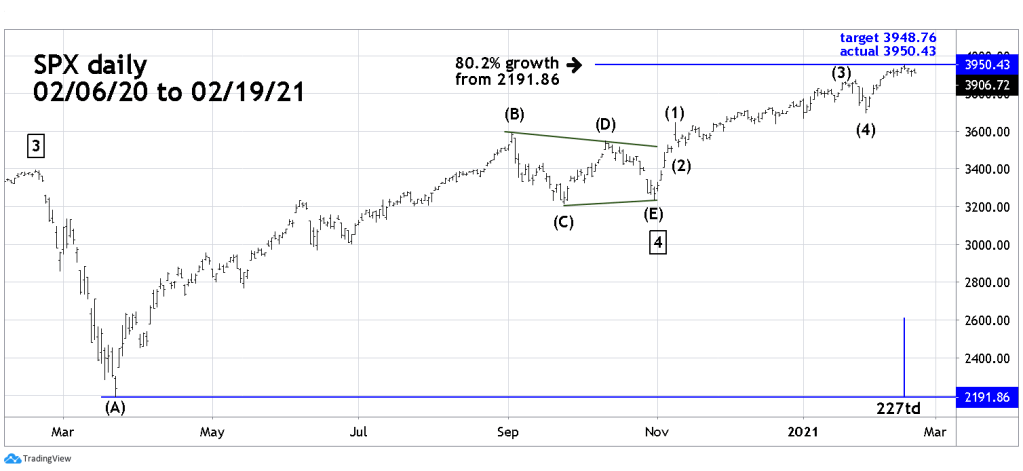
The movement from February 2020 to October 2020 is probably an Elliott wave – Horizontal Triangle. Normally in this pattern, a forecast for the post triangle movement is made by taking the widest part of the triangle and adding it to the triangle termination point. In this case Intermediate wave (E). Sometimes the forecast can be made from the triangles extreme point. In this case Intermediate wave (A).
As of 02/16/21 the SPX growth from the March bottom was 80.2% the exact match with the 2009 to 2010 rally is at SPX 4008. The bull move from 03/23/20 has so far been 227 trading days. To equal the 2009 to 2010 rally, the current movement would have to continue until 05/11/21.
Amazingly the 2020 to 2021 bull move is more dynamic than 2009 to 2010.
The 02/13/21 blog “Final Wave Up for the US Stock Market?” noted there was short-term Fibonacci resistance at SPX 3948.76 and could be reached in the first half hour of trading on 02/16/21. The SPX high on 02/16/21 high was 3950.43 made 18 minutes after the start of the trading session. As of 02/19/21 that high is still in place.
The SPX weekly chart 2007 to 2021 illustrates a fascinating Fibonacci relationship.

After the 2009 to 2010 rally the SPX declined into a bottom at 1010.91 labeled in the first chart as Primary wave “2” boxed. The bull market high in May 2015 was 2134.72.
2134.72 – 1010.91 = 1123.81 x 1.618 = 1818.30 + 2134.72 = 3953.02 only 2.60 points from the 02/16/21 top of 3950.43.
The powerful Dow Jones Industrial Average 1932 to 1937 bull market kicked off a mega multi decade bull move and came after a nearly three-year bear market. The 2009 to 2010 kickoff rally came after a nearly one-and-a-half-year bear market. The bull phase that began in March 2020 came after a bear market that only lasted a month and a half.
Its possible that the current up move is the kickoff to a new multi-year bull market, but highly unlikely. Sustained bull moves come after a sufficient period of rest, just like a person needs sleep after a full active day. A one-and-a-half-month bear market is the equivalent to a 15- minute nap vs. eight-hours of sleep.
The move up from March 2020 appears to be a rare blowoff top. If so, after its climax the next bear move could at the very least last several months, possibly years.
Traders are holding 25% short non-leveraged SPX related funds from the open of trading on 01/07/21. Continue holding short with a stop loss on an SPX move above 3970.00.
