Today 01/21/21 the S&P 500 (SPX) made a marginal new all-time high. While doing this both external and internal momentum indicators gave clear bearish signals.
The daily SPX chart courtesy of Trading View illustrates external momentum indicators.
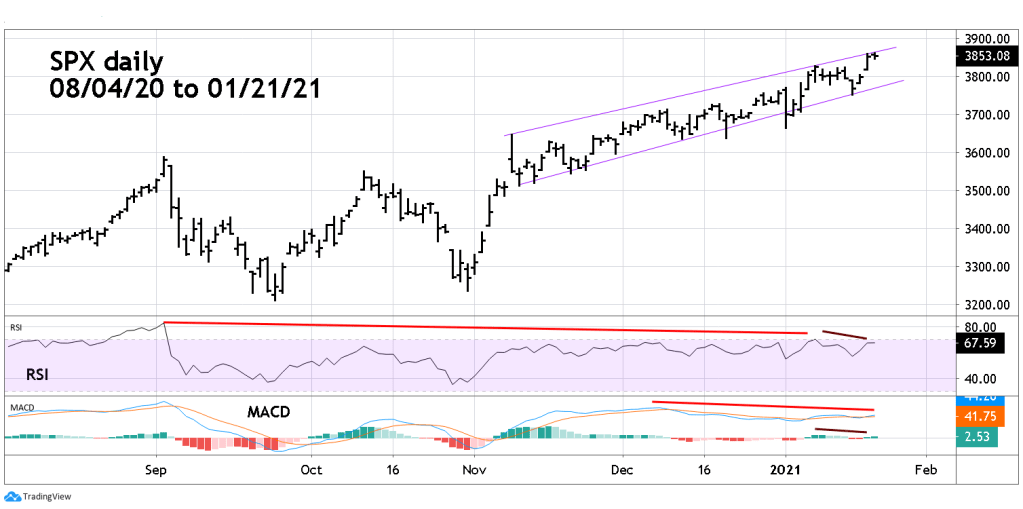
The daily RSI now has a double bearish divergence. The daily MACD has bearish divergences on lines and Histogram.
The daily NYSE – New 52 – Week Highs ($NYHGH) chart courtesy of StockCharts.com illustrates an internal momentum indicator.
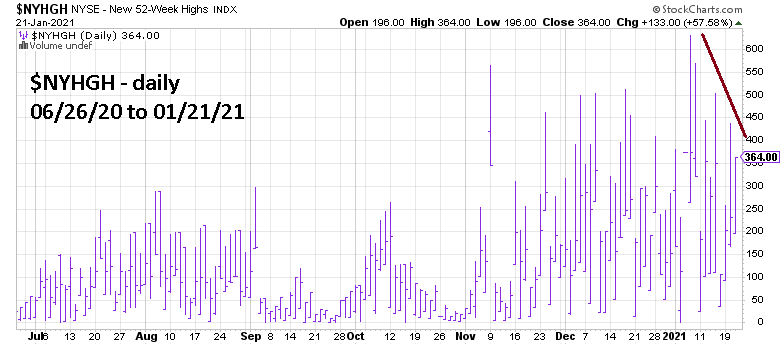
The falloff of stocks making new highs since the early January maximum is shocking.
Traders are holding short 50% non-leveraged SPX related funds from the open of trading on 01/07/21. Continue holding short,

Mark,
Thank you very much for you VIX observations.
It helped me stay the course this week 100 % Short,as the market was making all time highs again
and then close out the position profitably this morning, after the S+P 500 Futures had dropped sharply overnight.
LikeLike
Glad I can help.
LikeLike