The previous post examined the weekly Elliott Wave count of Zoom Video Communications Inc. stock symbol (ZM). After a stock has increased more than seven times in ten months some analysists could state the stock had reached its peak. Perhaps this is true for ZM, however there could be one more buying opportunity.
The hourly ZM chart courtesy of Trading View narrows the focus on the Elliott Wave count.
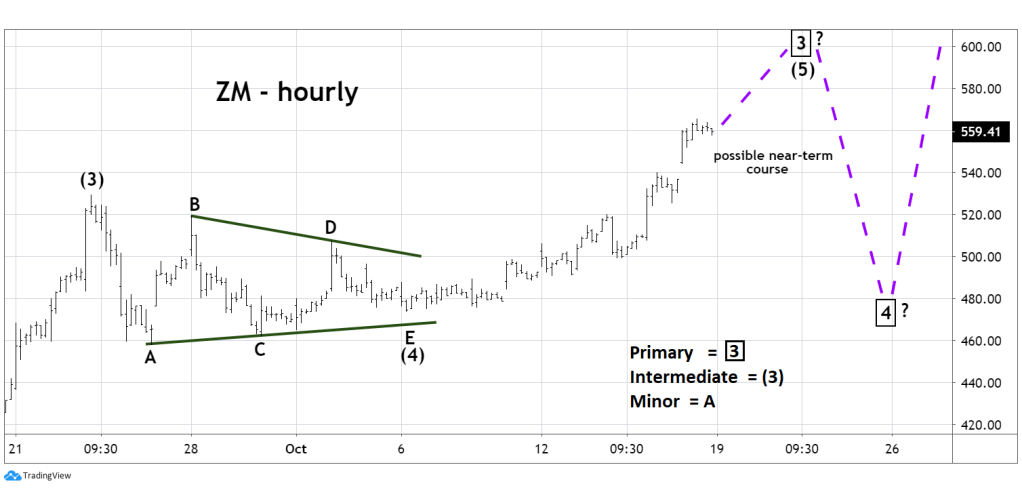
The correction from the September 23rd top took the form of an Elliott Wave – Horizontal Triangle, labeled Intermediate wave (4). The subsequent rally is referred to as a post triangle thrust, and that’s exactly what’s happened.
If the weekly Elliott Wave count is correct, the next rally high could just be the penultimate top and the subsequent decline could provide an opportunity to buy ZM. In Elliott Wave analysis, corrections especially if they are fourth waves usually find support/resistance in the area of the fourth wave of one lesser degree.
The next high point for ZM could be Primary wave “3” – boxed. The subsequent decline could be Primary wave “4” and find support at the fourth wave of one lesser degree – Intermediate wave (4).
The progress of ZM will be followed closely, updates to be posted when necessary.

Thanks a bunch, Mark. I’ve been thinking about buying Zoom — it seems that everybody is on it these days. I’m glad there is further upside in the future.
LikeLike
Your welcome.
LikeLike