The prior blog post noted that short-term market timers had become excessively bearish, a condition that implied US stocks could be at or near a bottom.
The hourly S&P 500 (SPX) chart courtesy of Trading View illustrates a choppy decline September 2to September 24. This appears to be an Elliott Wave Double Zigzag corrective pattern. The clearest part of the structure is the middle portion – labeled as Minor wave “X”. This pattern looks very much like an Elliott wave – Expanding Flat.
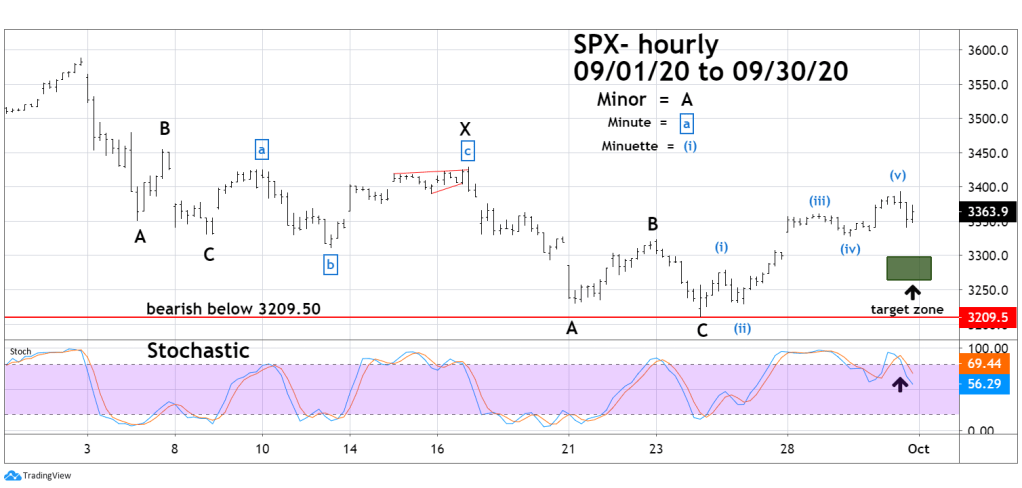
So far, the pattern from the September 24th bottom looks like a clean five wave Elliott Impulse. If so, this could be the first wave up of a larger rally that could continue until at least January 2021.
Note that late in the trading day September 30th the hourly Stochastic had a bearish crossover, which implies the SPX could decline over the next one to three trading days. If the high made on September 30th holds, the most likely area for the next bottom could be in the area of a .618 retrace of the five waves rally from September 24th . If the first wave up is complete, second waves frequently retrace at least .618 of the first wave.
A break below the September 24th bottom at 3209.50 would open the door for more downside action.
Evidence is swinging bullish: first from the sentiment dimension – excessive bearishness from short-term market timers. Second from the price dimension – five wave Elliott Impulse.
The time dimension – in the form of bearish seasonal patterns could continue until mid-October. Seasonal patterns are not precise and can end early. In the next few trading days, we may know if this year’s bearish season could continue or is complete.

Mark, your comments are very helpful as we begin the month of October — which has traditionally been a volatile one for the market. Your insights are greatly appreciated!
LikeLike
Thanks we could have more bullish information in just a few days.
LikeLike