There are two methods to measure market momentum. For all markets, price oscillators such as Stochastic and RSI are great for signaling trends, they are called external indicators. The Stock market is unique because momentum can be measured by its components, such as Advance/Decline lines and new 52-week highs/lows. These are referred to internal indicators.
The first chart courtesy of Stockcharts.com illustrates the NYSE- new – 52 – week highs since the start of the secular bull market in March 2009.
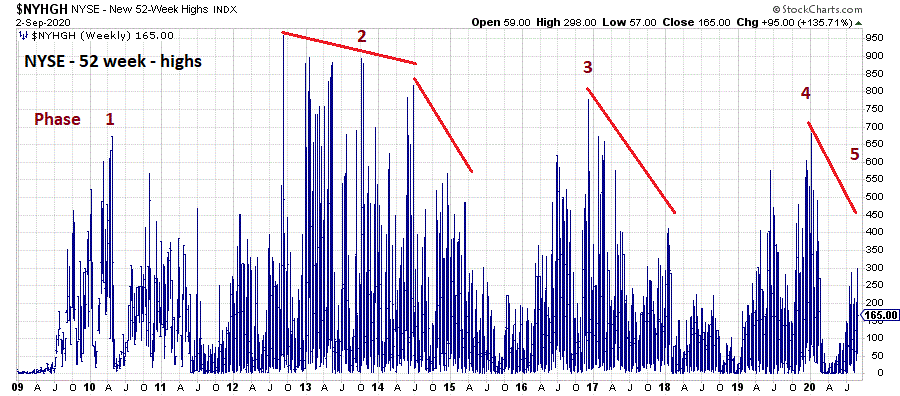
There have been five phases of new highs since 2009 which interestingly is another way of view the Elliott Wave theory. Phase 1 is the kickoff – possibly Elliott Wave “one”, Phase 5 is the possible termination and Elliott Wave “five”. Phases 2 through 4 represent an extended Elliott Wave three, with Phase 2 as sub wave “one” Phase 3 as sub wave “three” and Phase 4 as sub wave “five”.
After phase 1 new highs increased early into phase 2, throughout phase 2 the number of new highs decreased. This phenomenon continued through phase 3 to 5, note that within phases 2, 3 and 4 new highs decreased during each phase. This is the typical action that occurs in stock bull markets, the further the stock market rises fewer and fewer individual stocks make new highs.
The weekly S&P 500 (SPX) chart from Trading View illustrates where in the secular bull market each phases new high peak occurred.

Phase 1 had its peak new highs at the same time the SPX was making its phase 1 high. This is a rare occurrence – new highs normally peak months before a stock index makes a top.
During phase 4 new highs topped about a month before the SPX peak. This short duration was caused by the onset of the Coronavirus. What happened in February 2020 was the equivalent of slamming on the breaks of an automobile traveling at maximum speed. Had the virus crisis not happened US stock indices most likely would have continued rising with new 52 -week highs decreasing.
The shockingly low number of new highs in phase 5 is further evidence that the bull run that began on March 23, 2020 is not the kickoff phase of a new secular bull market. It’s probably the termination phase of the secular bull market that began in March 2009.
The maximum number of new highs for phase five occurred near the SPX rally high and implies the phase 5 rally could continue for several more months.
Most investors are currently doing very well with stock mutual funds, many of their individual stocks are probably lagging the mutual funds and this situation is likely to continue if the stock indices continue climbing.
My next blog will examine SPX near term action and trading strategies.

Thanks once again, for explaining stock market dynamics to the public in an easy-to-understand way, Mark. The charts are really helpful as well. Keep up the excellent work!
LikeLike
Thanks
Glad I can help.
LikeLike