A main aspect of the Strat method is that a break of the high/low of the prior bar could target the high /low of the next prior bar.
The quarterly – three-month S&P 500 (SPX) chart courtesy of Trading View illustrates a potential major break point.
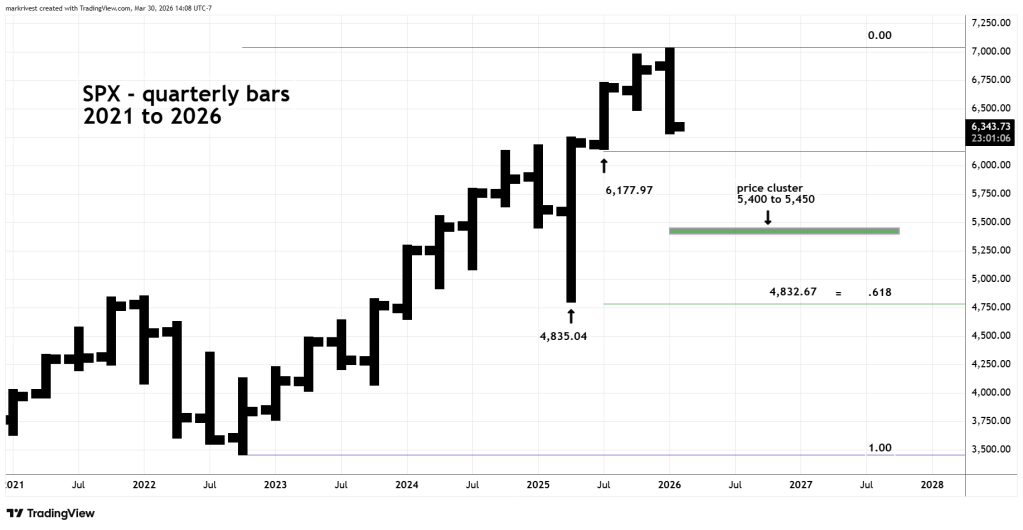
The next quarterly bar bottom is at 6,177.97, a move below this level could open the door for a move down to the prior quarterly bar low at 4,835.04.
This level is amazingly close to a Fibonacci .618 retracement of the October 2022 to January 2026 bull market.
If SPX breaks below the price cluster noted in the prior blog at 5,400 to 5,450, there could be a move down to the 4,830 area.
