All markets go through a cycle of growth and rest. Unending growth is not possible, at some point there’s needs to be rest, in terms of a stock market the “rest’ is a decline.
Sometimes events outside the domain of normal economic activity could increase the depth of a stock market decline.
The Covid crisis in early 2020 is a perfect example of an event outside the domain of normal economic activity. In January 2020 – U.S. stock market momentum was strong and could have continued rising for several weeks before topping out.
In February to March 2020 the S&P 500 crashed 35% – a very rare event, the last crash of this size happened in 1987 and before that 1929. If Covid had not occurred it’s likely any decline could have been in the range of 15 to 20% – a typical bear market.
The current Iran war is an event outside the domain of normal economic activity.
There are two scenarios that could happen during the next two weeks. The bullish scenario – Iran agrees to the U.S. – Fifteen-point plan to end the war. If this happens it could trigger a global stock market rally.
The bearish scenario – the U.S. sends ground forces into Iran. This could trigger a stock market crash.
The weekly S&P 500 (SPX) chart courtesy of Trading View illustrates long-term Fibonacci retracement levels.
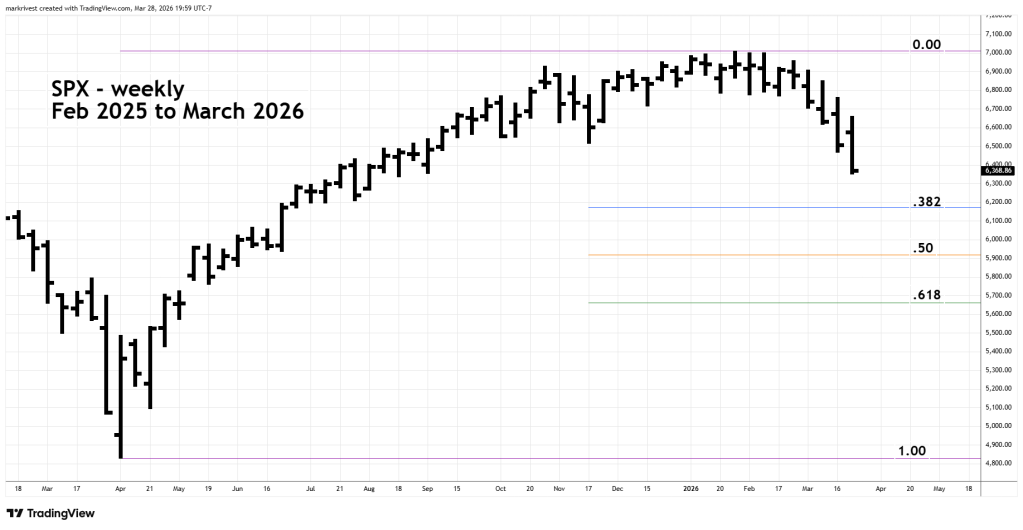
When using Fibonacci analysis start with the most prominent market segment, in this case it’s the April to January 2026 bull market.
The nearest Fibonacci retracement level is near 6,170, if the SPX breaks below that level it could decline to the .50 retracement level near 5,920. The deepest potential Fibonacci support level is a .618 retracement at 5,660.
Point & Figure charts are a great tool to discover potential support/resistance areas.
Point and figure charts focus on price movements and trends without time consideration, using X’s for rising prices and O’s for falling prices.
The Point and Figure chart for the S&P 500 ($SPX) courtesy of StockCharts.com shows the Fibonacci resistance levels relative to Point & Figure price clusters.
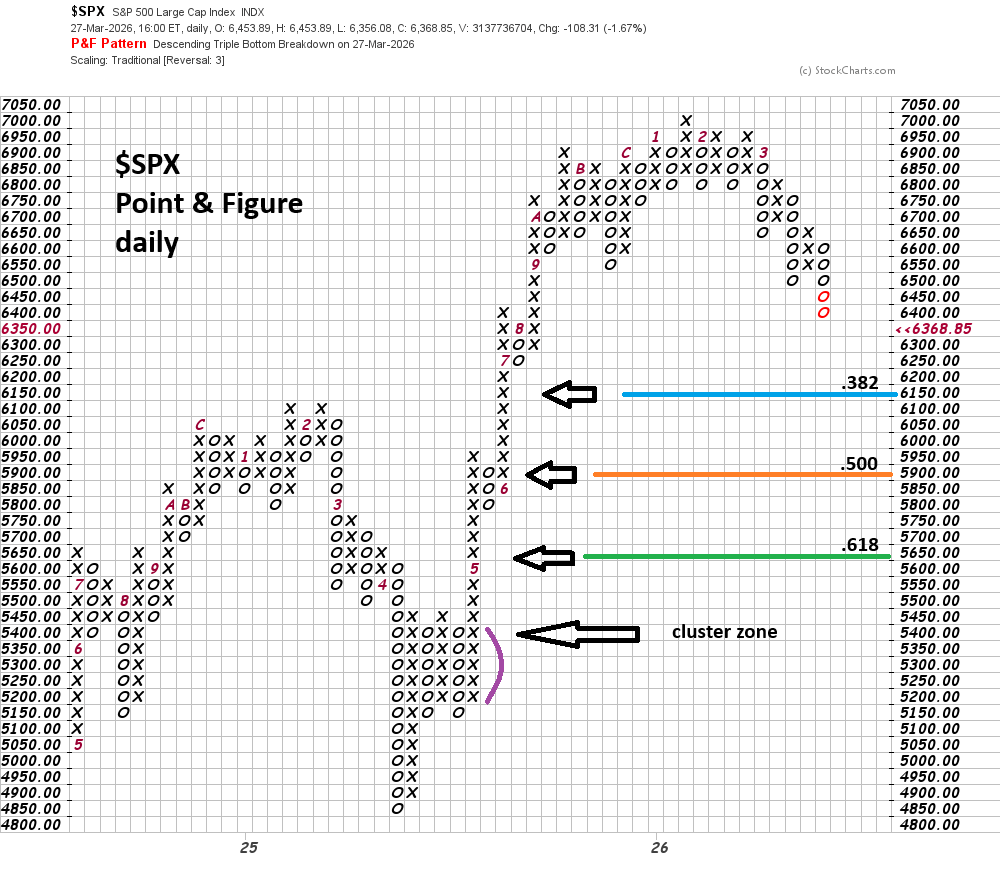
The wider the row of X’s and O’s, the greater potential support/resistance.
The 03/26/26 blog” Resistance at the 200 – Day Moving Average – March 2026” illustrated that the Fibonacci .382 level was just below chart support. However, on the Point & Figure chart there is no price cluster, decreasing the probability of a bottom forming in this area.
The Fibonacci .50 level has a greater chance of support – there’s a row of three X’s and O’s.
The .618 retracement level has no price cluster.
Moving down to 5,400 to 5,450 there is the first row of six X’s and O’s, if there’s a move below 5,660 there’s a good chance a bottom could be made in the 5,400 to 5,450 area.
Anything could happen during the next two weeks, be prepared.
