The 03/07/26 blog “S&P 500 – Support Zone – March 2026” noted “If the SPX trends down, there’s a good chance a bottom could be made in the 6,550 to 6,470 area”.
The 03/21/26 blog “S&P 500 – Support Zone Reached – 03/20/26” noted “On 03/20/26 the S&P 500 (SPX) bottomed out at 6,473.52”.
The daily SPX chart courtesy of Trading View shows what has happened since 03/20/26.
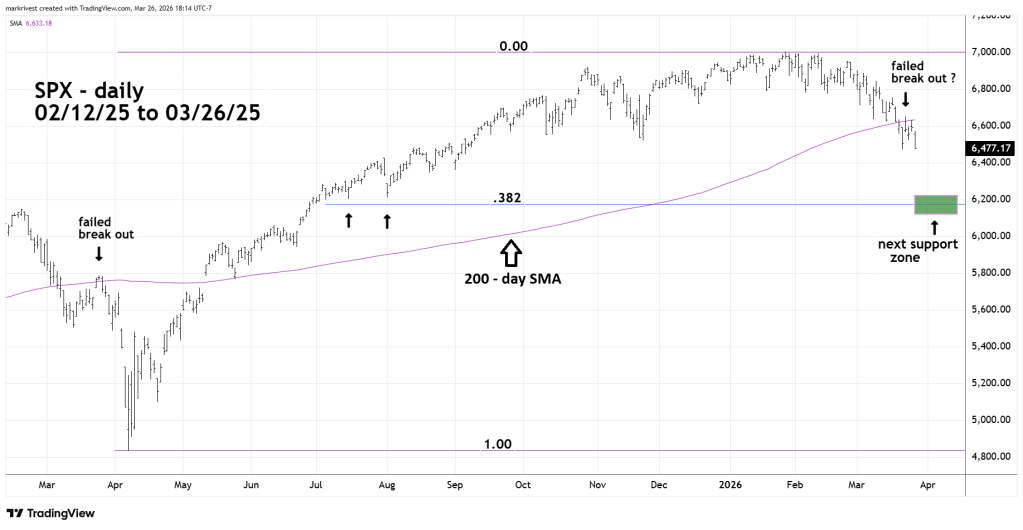
The subsequent rally only lasted about one -trading day that broke marginally above the 200 – day Simple Moving Average (SMA). This is like what happened in late March 2025 which opened the door for another decline.
The SPX bottom on 03/20/26 was 6,473.52, the low on 03/26/26 was 6,473.79. A move below 6,473.52 could trigger a move down to a Fibonacci .382 retracement of the April 2025 to January 2026 rally.
The broad support zone is 6,120 to 6,220.
