The weight of evidence from all four dimensions of the U.S stock market is overwhelmingly bearish. However, the NYSE – Advance/Decline line and the S&P 500 – Advance/Decline line continue to make new highs.
The daily NYSE – Advance Decline line ($NYAD) courtesy of StockCharts.com is illustrated below.
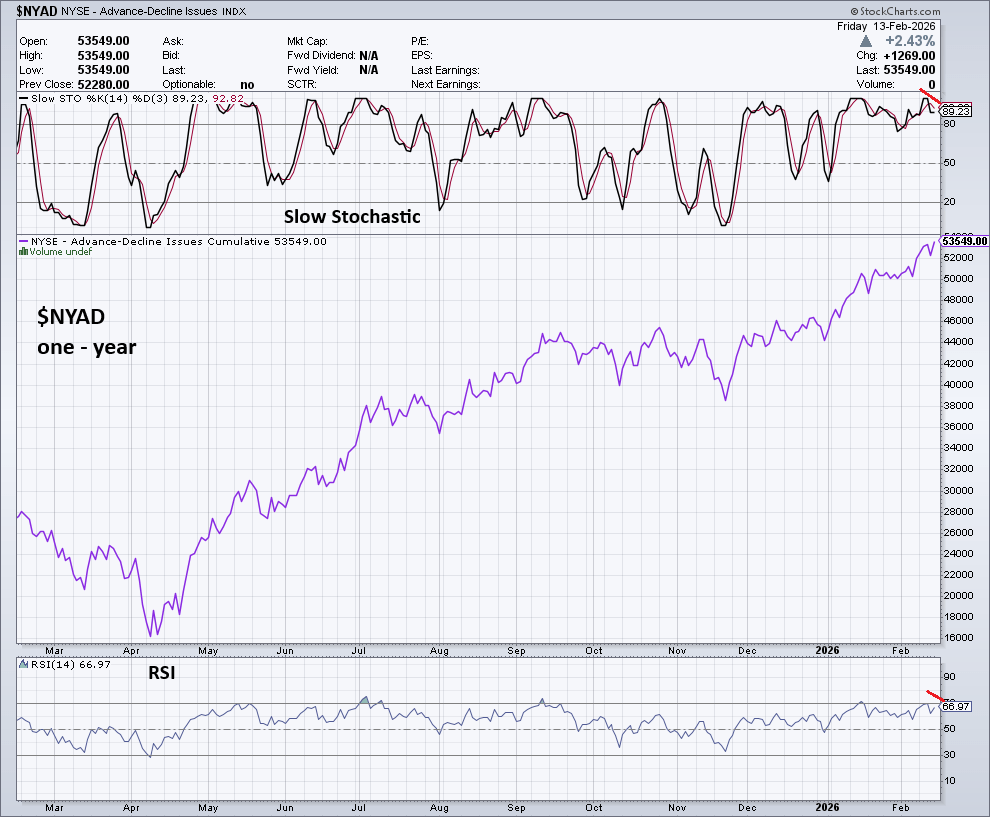
On 02/13/26 the NYSE Composite index failed to reach a new high. $NYAD made a new high. Slow Stochastic and RSI for $NYAD had bearish divergences hinting a peak could be developing.
The daily S&P 500 – Advanced/Decline line (SPXADP) is shown on the next chart.
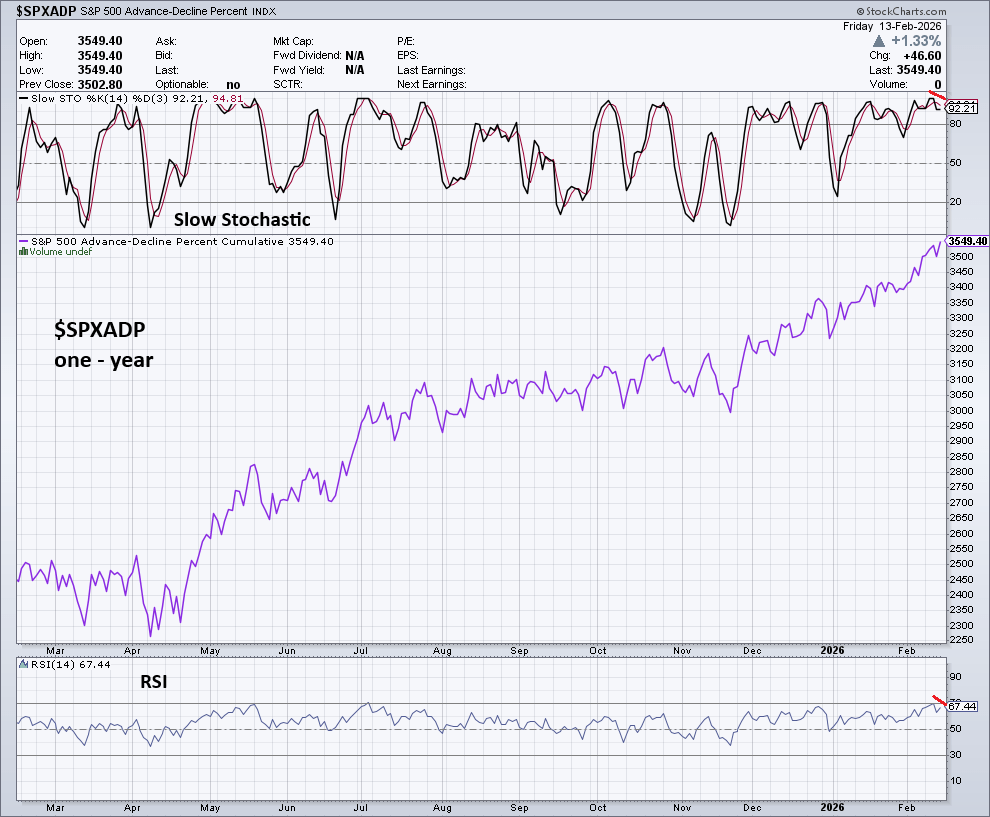
On 02/13/26 the S&P 500 failed to reach a new high. $SPXADP made a new high and its Slow Stochastic and RSI also have bearish divergences.
A summary of the main bearish elements for the U.S. stock market is listed below.
Time dimension: the 02/08/26 blog “Incredible Dow Jones Industrial Average – Time Cycles” illustrated very long – term time cycles indicating the Dow Jones Industrial Average could be making a significant peak.
Price dimension: the 02/07/26 blog “Dow Industrials at 50,000! Illustrated that Dow Jones Jone Industrial Average was in proximity to potential major Fibonacci resistance.
Sentiment dimension: the 01/11/26 blog “Sentiment – U.S. Stock Market – January 2026” noted that readings from Market Vane bullish consensus and VIX indicated that a major U.S. stock market peak could be forming. Going into February 2026 these readings continued to be bearish.
Momentum dimension: the 02/08/26 blog “Bearish Divergences – February 2026” noted that other main U.S. stock indices failed to confirm the Dow Jones Industrial Average new high.
Anything can happen in the markets, including unprecedented events. If there’s major U.S. stock market peak, it could be the first time it occurred with a rising Advance/Decline line.
Is the bullish Advance/Decline line a fake out, or the prelude to a continuing stock bull market? We could soon have an answer.
