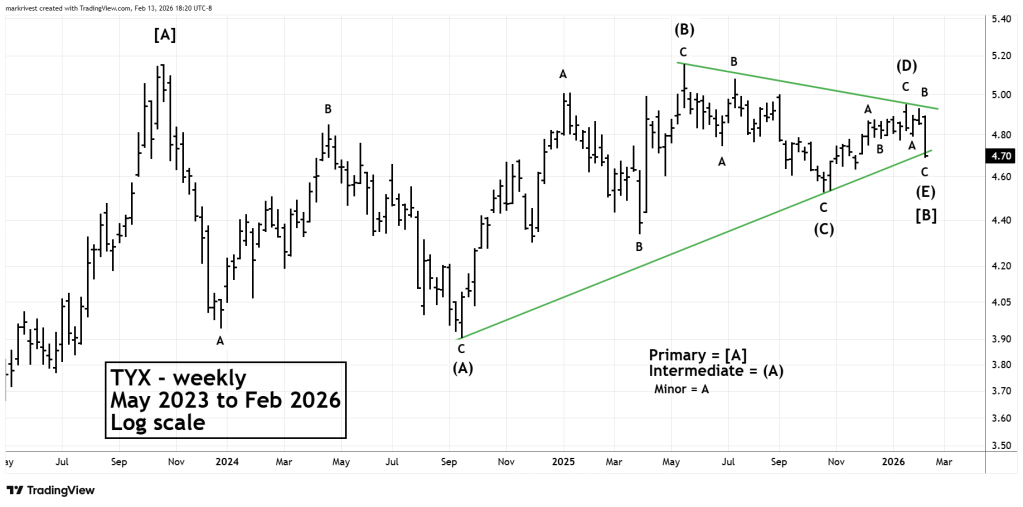
An Elliott wave – Horizontal Triangle correction that began in October 2023 may have concluded February 13, 2026.
Elliott Wave – Horizontal Triangles are net sideways corrections that are composed of five sub- waves. Each sub – wave further divides into three waves or a combination of three waves. Horizontal Triangles only appear in the fourth wave position of motive waves, and in the “B” wave position of corrective patterns. They usually form within the boundaries of contracting trendlines. On rare occasions they form within expanding trendlines.
The weekly chart of the CBOE – 30 – year Treasury Bond Yield (TYX) courtesy of Trading View shows what’s happened since late 2023. For the sake of simplicity each Intermediate degree sub – wave is illustrated as a Single Zigzag.
There are usually Fibonacci relationships among the five sub – waves.
In this case Intermediate wave (A) is equal to Intermediate wave (B).
Intermediate wave (C) is .50 of Intermediate wave (B).
Intermediate wave (D) is close to .618 of Intermediate wave (C).
Intermediate wave (E) is .618 of Intermediate wave (D).
After conclusion of a Horizontal Triangle there’s usually a thrust in the direction of the main trend. Which in this case is up.
A move below the October 2025 bottom labeled Intermediate wave (C) will invalidate this wave count.
If the Horizontal Triangle is complete there could be a multi – month TYX rally that exceeds the double peak at 5.15.
A rise in long-term U.S. interest rates could be a factor for a possible multi-month decline in U.S. stocks.
