Very long- term cycles indicate the Dow Jones Industrial Average (DJI) could be making an important peak.
The yearly DJI chart courtesy of Trading View examines the big picture.
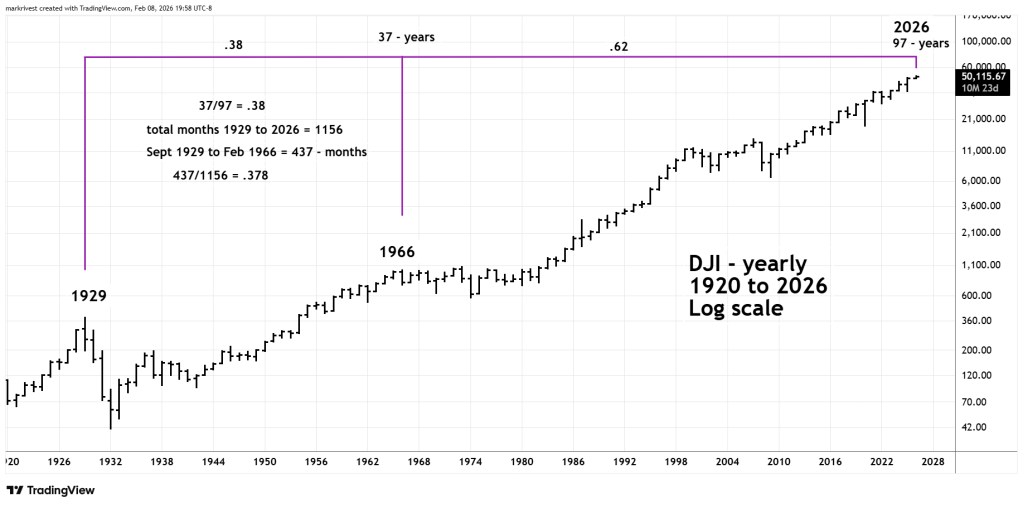
It’s been 97 – years since the bull mania peaked in September 1929. The entire movement has a Fibonacci bisect in 1966. This was when the DJI first reached 1,000 and was the pinnacle of a 34 – year secular bull market that began in 1932.
The time between 1929 and 1966 is 37 years, divided by the total 97- years is the Fibonacci .38 ratio.
The total span 1929 to 2026 is 1,156 months. The monthly span from 1929 to 1966 is 437 – months. The ratio of 437/1,156 is .378 close to a Fibonacci .382.
The day DJI hit its final 1966 top is fascinating and is illustrated on the daily DJI chart from 1965 to 1966.
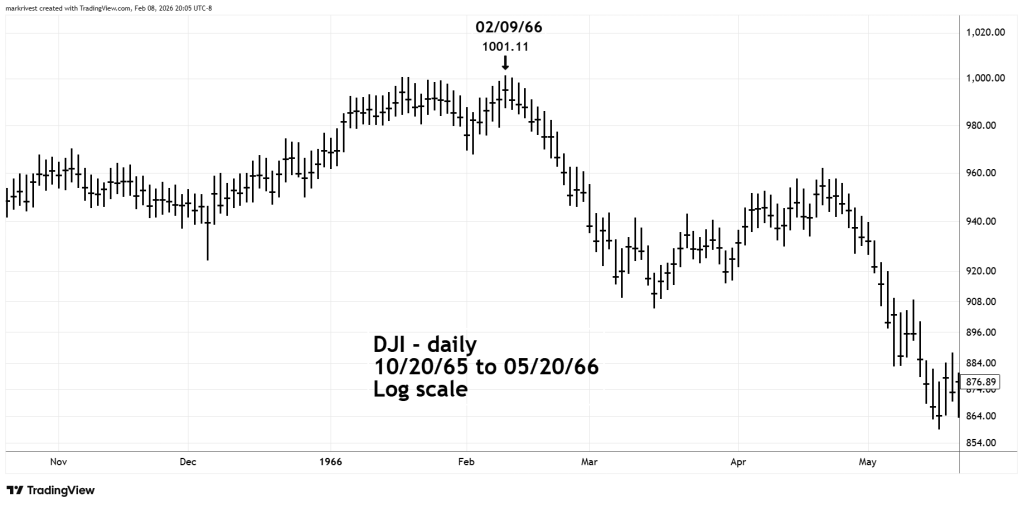
The ultimate top of the 1966 bull market was 02/09/66. If the 2026 DJI made its final top on 02/06/26 it’s within one trading day of the anniversary.
If the DJI makes its final peak on 02/09/26 it would be amazing!
