The prior blog “Dow Industrials at 50,000!” noted that the Dow Jones Industrial Average (DJI) all-time high was confirmed by the Dow Jones Transportation Average, NYSE Composite index, S&P 500 – Advanced/Decline line and NYSE Advance/Decline line.
Now a look at what’s not confirming the DJI all-time high.
Since the most recent bull trend began in April 2025, the DJI has gained 37.50%. The daily S&P 500 (SPX), Nasdaq Composite (IXIC), and the Semiconductor index (SOX) chart courtesy of Trading View illustrates their action since April 2025.
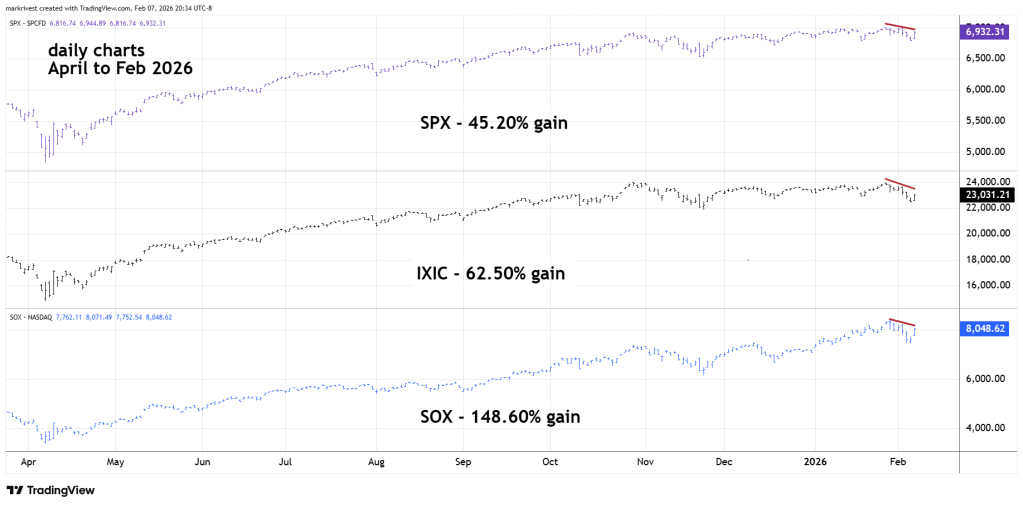
At their respective peaks SPX had gained 45.20%, IXIC gained 62.50% and SOX gained an incredible 148.60%. Yet on 02/06/26 all three failed to confirm the DJI all-time high.
DJI since April has been the weakest in growth. Now its leading – very peculiar.
The 11/16/25 blog “Using Bitcoin to Time a U.S. Stock Market Peak” examined the relationship between Bitcoin in U.S. dollars (BTCUSD) and U.S. stocks.
BTCUSD tends to make significant peaks before the main U.S. stock indices.
The weekly BTCUSD and DJI chart examines their relationship since 2019.
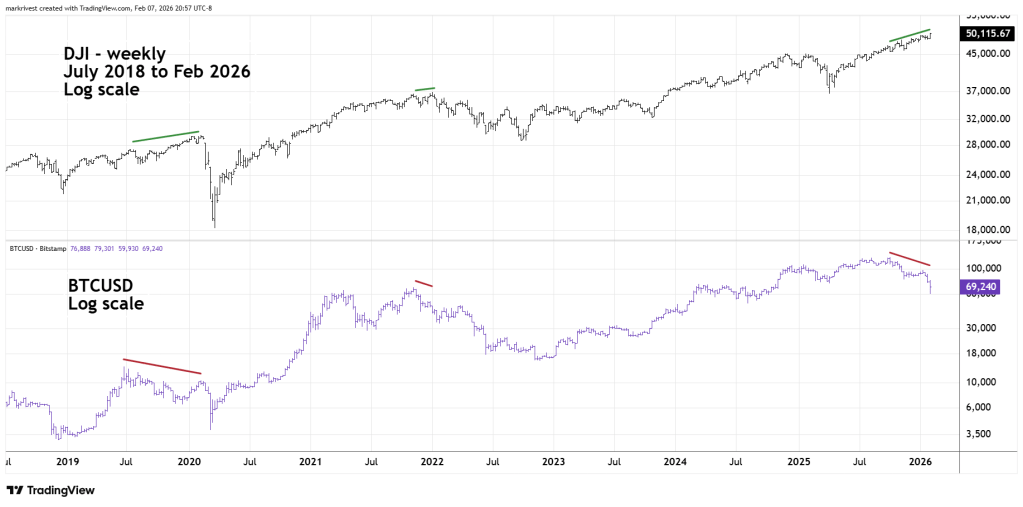
As of 02/06/26 while the DJI was reaching an all-time high, BTCUSD had declined 44% from its all-time high in October 2025. A tremendous divergence!
Currently the most bullish factor for U.S. stocks is that both the NYSE and S&P 500 – A/D lines are at all-time highs. Anything can happen in the markets, and sometimes important turns can be made with false signals.
A resolution of the bullish confirmations and bearish divergences could come very soon.
