The action of stocks during the week of 01/18/26 to 01/24/26 was like what happened in April 2025. A drop on bearish tariff news then a rally on bullish tariff news.
Intraday and daily price action give clues to what may occur next week.
Trading View has a stock index – symbol (SPX500). This index closely matches the price levels of the S&P 500 – cash index (SPX). It also closely matches the price movements of the S&P 500 – futures outside of the regular SPX trading hours – 9:30 AM – EST to 4:00 PM – EST.
The 15 – minute SPX500 chart illustrates its most recent action.
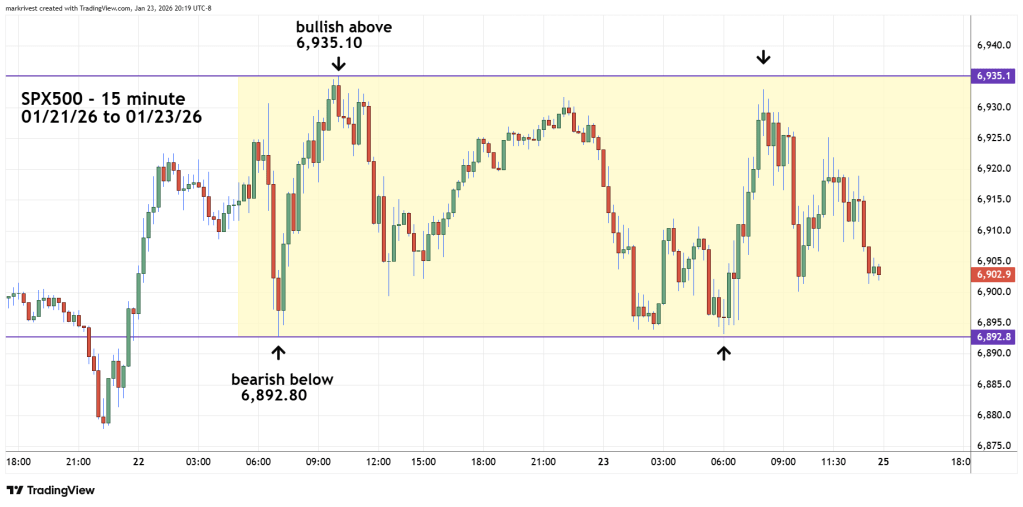
After the bottom on 01/20/26 there was a strong rally that failed to reach a new all-time high.
From 01/22/26 to 01/23/26 a sideways channel formed. A move above the double top near 6,935.10 is bullish. A move below the double bottom near 6,892.80 is bearish.
The daily Russell 2000 chart (RUT) from Trading View reveals a fascinating clue.
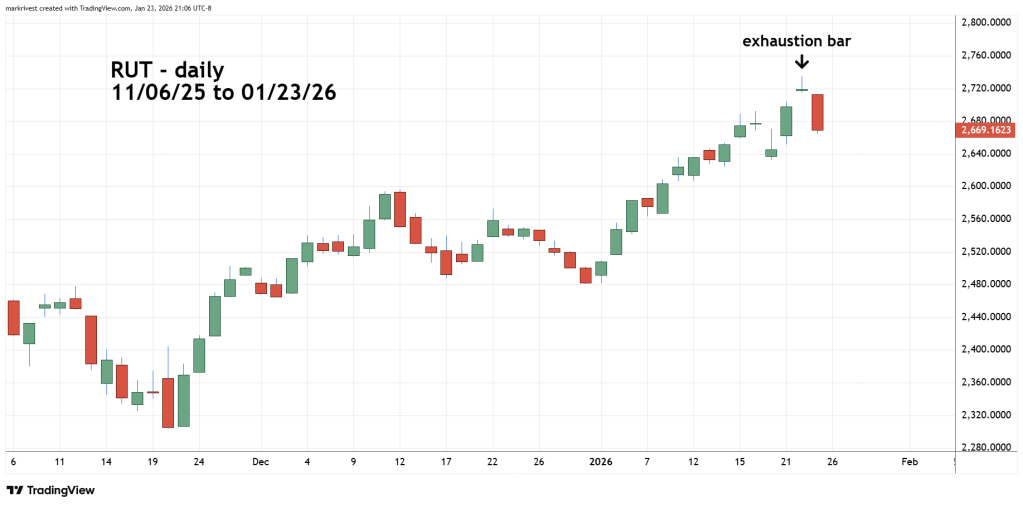
Last week none of the three main U.S. stock indices; S&P 500, Nasdaq Composite, and Dow Jones Industrial Average made new all -time highs. The RUT – small cap stocks did make a new all-time high.
The move to new high on 01/22/26 was an exhaustion bar – a very bearish signal. The price move on 01/22/26 gapped above the 01/21/26 daily bar. The move down on 01/23/26 gapped below the 01/22/26 bar, creating an island top.
If RUT ends the 01/26/26 trading day below the 01/23/26 low, it could trigger a multi- week decline for U.S. stocks.
