Markets can sometimes have significant turns on or near the cusp of a new year. What happened with the S&P 500 (SPX) in December 2025 could be the inverse of what happened in December 2018.
The daily SPX chart courtesy of Trading View illustrates what happened late 2018 and early 2019.
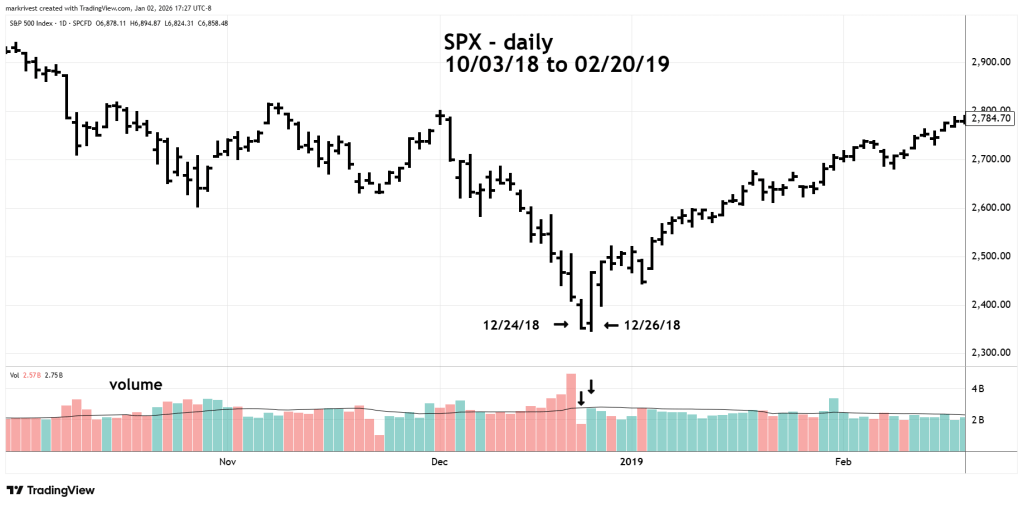
From October to December 2018 there was a rare counter seasonal decline. Normally this is a very bullish time for U.S. stocks. The bottom came on the trading days bracketing Christmas. A low was made on the half session trading day of 12/24/18. Then a marginal final bottom made on 12/26/18. Note the very low pre- and post-holiday volume.
Now let’s move forward and examine the SPX action in December 2025.
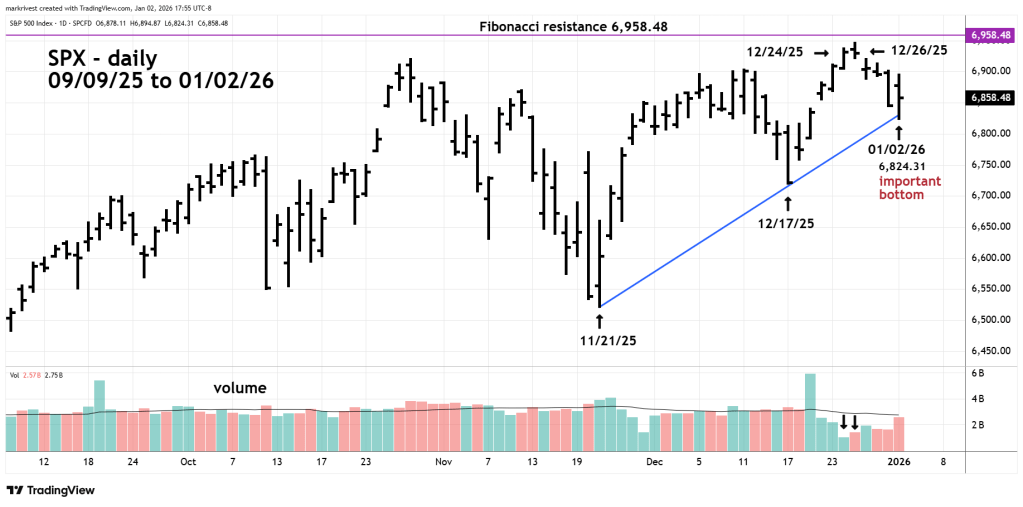
SPX made a new all-time high on 12/24/25 then made a marginally higher peak on 12/26/25. In this case the top was within leeway of significant Fibonacci resistance at 6,958.48 as illustrated in the 01/01/26 blog “Three Bearish Factors – 01/01/26”
That blog also illustrated that an Elliott wave – Ending Diagonal Triangle could be developing and that a new all-time high could be made on 01/02/26 or 01/05/26.
On 01/02/26 prior to the start of the SPX session at 9:30 AM – EST the S&P Futures were rallying. In the first 30 – minutes of the SPX session the rally continued. It appeared the bulls would be in control for the entire trading day. Then the bears took over and pushed SPX below the bottom it made on 12/31/25.
The SPX 01/02/26 bottom hit the rising trendline connecting the 11/21/25 and 12/17/25 bottoms.
The presumed SPX – Ending Diagonal Triangle wave count is still valid. However, if SPX breaks below 6,824.31 before a new all-time high is made, an important peak may have been reached on 12/26/25.
Watch for an SPX move below 6,824.31.
