Occasionally markets can have significant turns on the cusp of a new year. Within the last ten – years the S&P 500 (SPX) has had trend changes near a new year. This phenomenon could be repeated in 2025/2026.
The daily SPX chart courtesy of Trading View illustrates the most recent turn in early 2022.

Early 2022 was the climax of a monstrous bull market that began after the Covid crash in March 2020. The SPX gained 31% from January to December 2021.
Stock portfolio managers’ performance is based on annual results. Perhaps stock fund managers wanted to defer selling into 2022 to show the best possible results for 2021. Subsequently there was a ten – month 27% decline.
Note that the SPX 2022 peak came one day after the New Moon.
The next SPX daily chart shows what happened in 2018.
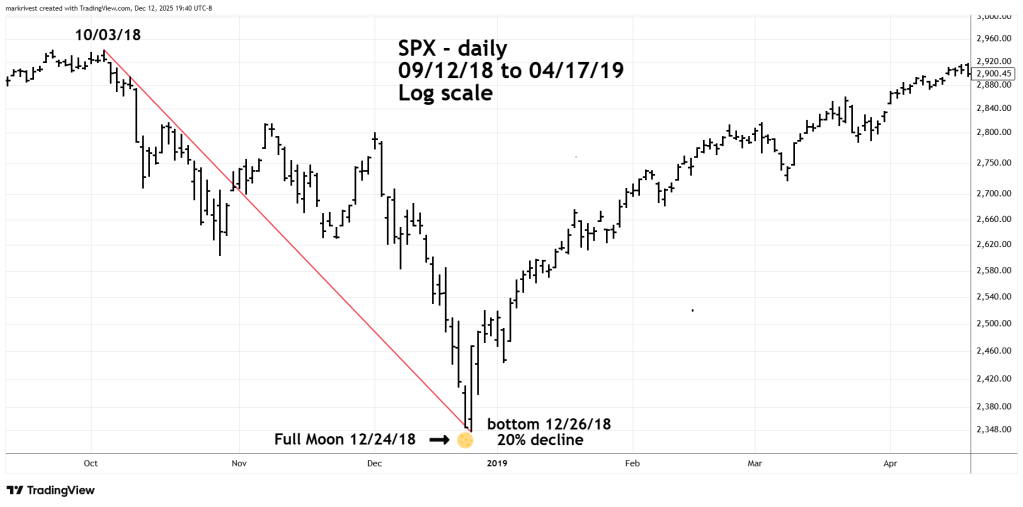
There was an unusual counter seasonal move in the last quarter of 2018. Most of the time U.S. stocks are bullish from October to December. Not in 2018 which saw SPX drop 20%. This is a perfect example of how anything can happen in the markets.
In this case the bottom was made one trading day after a Full Moon.
The final SPX daily chart illustrates a peak made in late 2015.

This was not a primary or secondary peak, but it occurred after a Full Moon late in the year. Subsequently there was a sharp 13% drop.
There’s a New Moon on 12/20/25
There’s a Full Moon on 01/03/26.
