The 11/16/25 blog “Using Bitcoin to Time a U.S. Stock Market Peak” examined the time dimension relationship between Bitcoin (BTCUSD) and U.S. stocks. Evidence indicated that U.S. stocks could be forming a significant peak.
A focus on the price dimension relationship between Bitcoin and the S&P 500 (SPX) comes to the same conclusion – U.S stocks could be nearing a peak.
The weekly BTCUSD and SPX courtesy of Trading View illustrates their recent relationship.
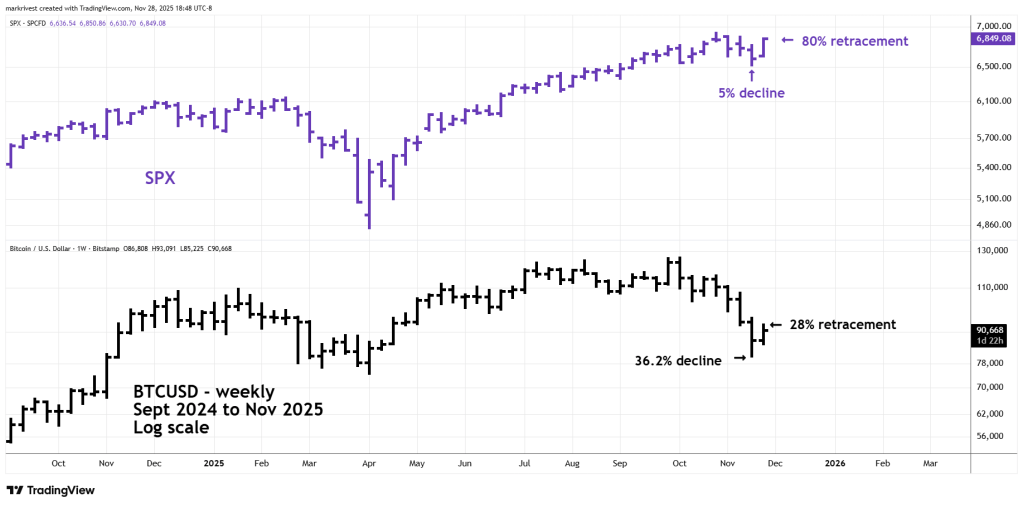
In less than two months BTCUSD has dropped 36.2%. This is huge! BTCUSD is probably in the early part of a multi-month bear trend. SPX most recent decline was only 5% and appears to be on the verge of another new all-time high. The corresponding BTCUSD rally has retraced only 28%. This is a gigantic divergence between markets that usually trend together.
The weekly BTCUSD and SPX chart from 2021 to 2022 show what happened after the last time there was a huge price divergence.

The BTCUSD 38.6% drop in 2021is close to the recent decline of 36.2%. The BTCUSD retracement of the 2021 decline corresponded with an SPX rally to a marginal new all-time high. Subsequently SPX went into a ten – month bear market.
If SPX makes a new all-time high and is near Fibonacci resistance at 6,958.48, a major peak could be made.
