Almost all markets have seasonal tendencies. Knowing which months are seasonally bullish or bearish is essential to trading extended price movements. Counter seasonal trends are also important. When a market moves against its seasonal pattern it could be heralding a major trend change. November 2025 could be signaling a major trend change for U.S. stocks.
Monthly statistical analysis of price changes is not based on the size of the movement. The only factor is where prices closed at the end of a time vs. where price movement began. For example, a stock ending the month down 1% has the same significance as a stock ending the month down 5%. Both instances are bearish.
The seasonal patterns graph courtesy of Unusual Whales reveals some fascinating data for the S&P 500 (SPX) Exchange Traded Fund ($SPY).
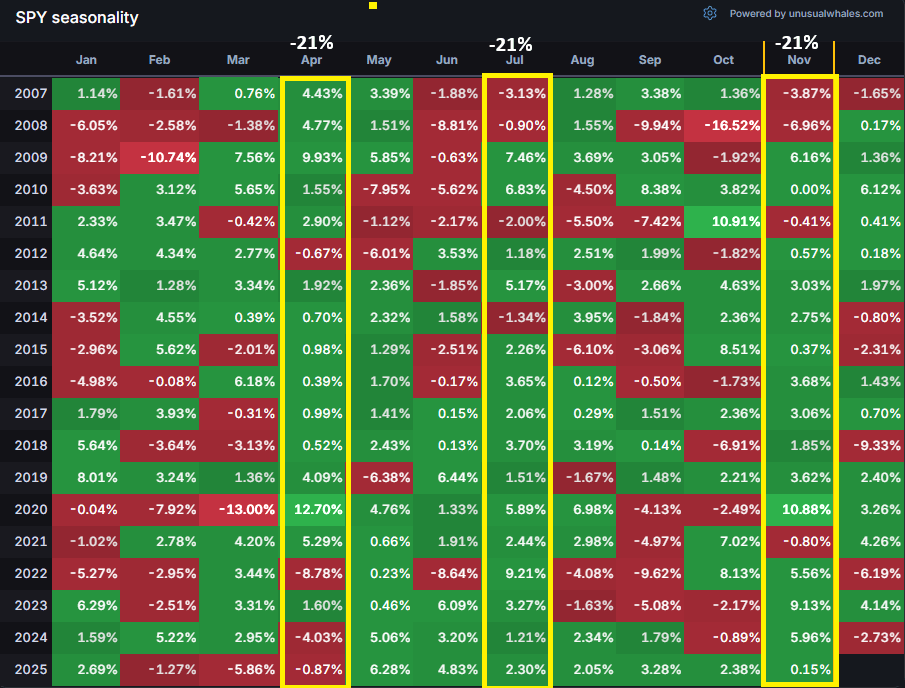
the S&P 500 (SPX) Exchange Traded Fund ($SPY).
The graph spans from 2007 to 2025. Note that April, July, and November are the most bullish months. Only four out of the nineteen months was bearish, a ratio of 4/19 or 21%. The bullish percentage is 79%. This simple statistical analysis tells you that in November -trade on the bullish side.
Expanding the time frame reveals more information.
The 11/30/21 blog “Bearish November Omen” examined SPX seasonal patterns from 2002 to 2020.
The seasonal patterns for SPX/$SPY April, July, and November 2002 to 2006 are as follows.
2002 – April – down
July – down
November – up
2003 – April – up
July – up
November – up
2004 – April – down
July – down
November – up
2005 – April – down
July – up
November – up
2006 – April – up
July – up
November -up
Of the 5 -years April up – 2, down – 3
July up – 3, down – 2
November – up – 5
The combined data from 2002 to 2025 shows the following bearish ratios.
April down 7 out of 24 or 29%
July down 6 out of 24 or 25%
November down 4 out of 24 or 16%.
Since 2002 – SPX/$SPY – November has been the most bullish month.
The monthly SPX chart from 2002 to 2009 shows what happened after a bearish November.

After a relentless five – year bull market the SPX did something different, it ended November 2007 down from its November opening value. Not only that, but it also took out the October and September 2007 bottoms. A very bearish signal!
Just looking at the SPX price action and a calendar was all that you needed to avoid a portfolio crushing multi-month bear market.
As we go into the last week of November 2025, the SPX is down 3.6% from its monthly opening and has gone below its October bottom. The last week of November is one of the slowest trading weeks of the year. On 11/27/25 the NYSE is closed for the U.S. Thanksgiving holiday. The next day there’s only half a day of trading.
What happens during the next three and a half trading days could be very important.
Watch the calendar!
