On 11/12/25 the Dow Jones Industrial Average (DJI) made a new all-time high unaccompanied by the other two main U.S. stock indices, S&P 500 (SPX), and the Nasdaq Composite. Since January 2000 this momentum divergence has signaled important U.S. stock market peaks. However, several of these signals have occurred in 2025 – all have failed. We could know in a few days if this current signal is valid.
The 30 – minute DJI chart courtesy of Trading View illustrates its intraday action.

The short-term momentum evidence is bullish. The DJI 11/12/25 peak was made with the 30 – minute RSI at its highest reading since the 11/07/25 bottom. Most stock index ultimate peaks occur with at least one RSI bearish divergence. The maximum RSI reading implies the DJI could soon make another new all-time high. A move below the 11/07/25 bottom could significantly add fuel to the bearish case.
The 30 – minute SPX chart updates its intraday action.
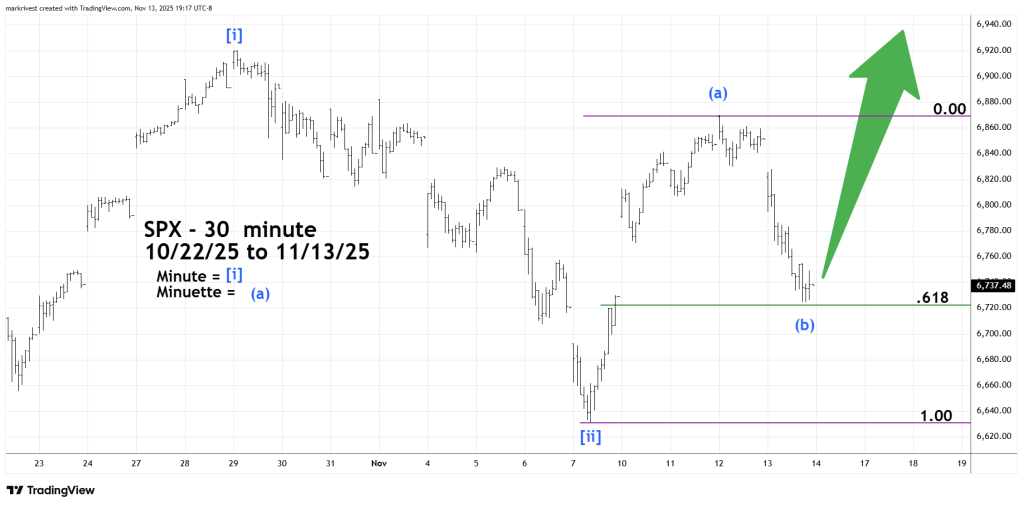
The 11/08/25 blog “Elliott Wave – Invalidation Points” illustrated that the SPX could be forming an Elliott wave – Ending Diagonal Triangle. If so, the bottom made on 11/13/25 could be Minuette wave (b) of a forming Minute wave [iii]. The low on 11/13/25 was close to a Fibonacci .618 retracement of the prior rally. This is a logical spot for a presumed Minuette wave (b) to bottom.
Longer-term seasonal patterns are bullish. November is statistically the most bullish month for U.S. stocks.
The next few trading days for U.S. stocks are important.
Watch the DJI 11/07/25 bottom.
