The 10/26/25 blog “S&P 500 – Elliott Wave Update – 10/24/25” illustrated that the S&P 500 (SPX) may have completed an Elliott wave – Ending Diagonal Triangle. The invalidation point for this pattern was SPX 6,813.85.
The 30 – minute SPX chart courtesy of Trading View shows what happened.
On 10/27/25 SPX gapped above the invalidation point. In Elliott wave theory there are always alternate wave counts. For Ending Diagonal Triangles, a trending pattern, the alternate wave count is a Horizontal Triangle, a sideways pattern.
The reason that these two patterns could be alternate is that they are each composed of five sub waves and each sub wave further sub divides into three waves. There’s no predestination in the markets. The mass mind like the individual can change their direction. Alternation is one of the ways markets can change courses.
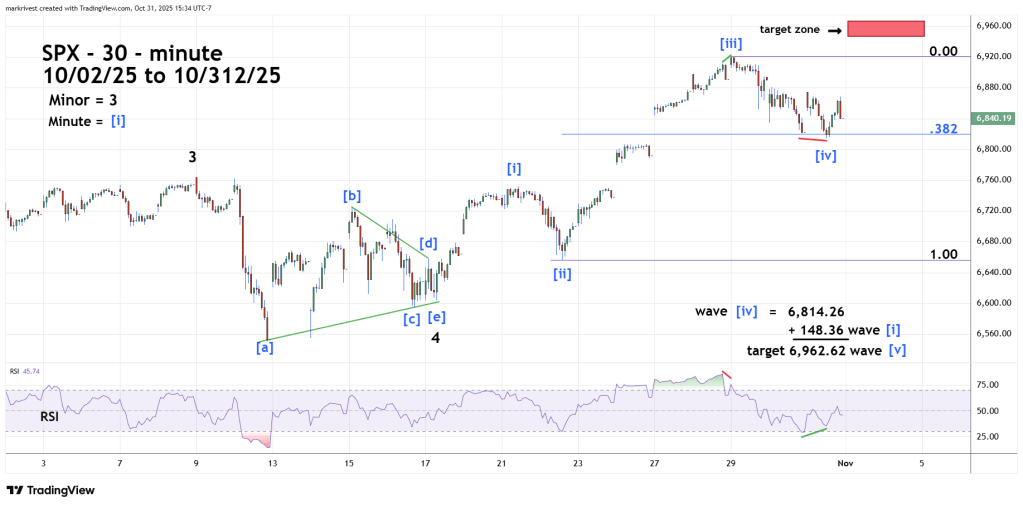
The choppy sideways movement from 10/09/25 to 10/17/25 appears to be a contracting Horizontal Triangle – a basing pattern for the next move up.
The subsequent rally has the smooth look of an Elliott impulse wave. The next rally from 10/22/25 to 10/29/25 is longer than the presumed Minute wave [i]. Third sub waves in impulse patterns are usually the longest and most powerful. Retracement of third waves are usually shallow, and a Fibonacci .382 retracement is common. Also note that the presumed Minute wave [ii] and [iv] are close to equal which is a common Fibonacci relationship of impulse wave corrections.
Most fascinating is that the termination points of Minute wave [iv] 6,814.26 is very close to the Ending Diagonal Triangle invalidation point of 6,813.85. This is a perfect example of prior resistance becoming support.
Equality is a common Fibonacci relationship of first and fifth waves of impulse patterns. The presumed Minute wave [i] was 148.36 points added to the presumed Minute wave [iv] bottom of 6,814.26 targets 6,962.62 as the potential termination point for Minute wave [v].
The SPX four – hour chart illustrates how the short – term October 2025 pattern fits in with the rally that began in April 2025.

If the SPX reaches a new all-time high during the week of 11/03/25 to 11/07/25 it could be the termination point of the impulse wave that began on 04/07/25.
Long – term Fibonacci analysis supports this theory.
Multiplying the February 2025 to April 2025 decline by the Fibonacci inverse ratio of 1.618 yields 2,123.42. Adding this to the 04/07/25 bottom of 4,835.04 targets SPX 6,958.47 very close to the Minute wave [v] termination point of 6,962.62.
The next blog will examine long and short-term sentiment for the U.S. stock market.
