Seasonal patterns for U.S. stocks are bearish from mid – August to October and bullish from November to April. U.S. stocks have rallied through September which is statistically the most bearish month. With the bearish season nearly complete, does this mean several more months of rallying? It’s possible however the S&P 500 (SPX) has not had a decline greater than 3% since mid-April. At the least a correction of 5 to 10% is due.
What about an October peak for U.S. stocks? A rare example of an October peak is illustrated in the daily SPX chart courtesy of Trading View.

Lunar cycles can also be a factor in market turns. Sometimes a turn can occur within two trading days plus or minus of New/Full Moons.
On 10/11/07 the peak of a five – year bull market happened on a New Moon.
The 08/10/25 blog “Time Cycles August 2025” noted that lunar cycles have an effective rate of only 25%. In sideways markets the effectiveness can increase. From July 2007 to February 2008 the effectiveness of signaling a one-to-two-week market move was about 60%.
In strong trending markets the effective rate is much smaller.
The daily SPX chart from April 2025 shows what’s happened.
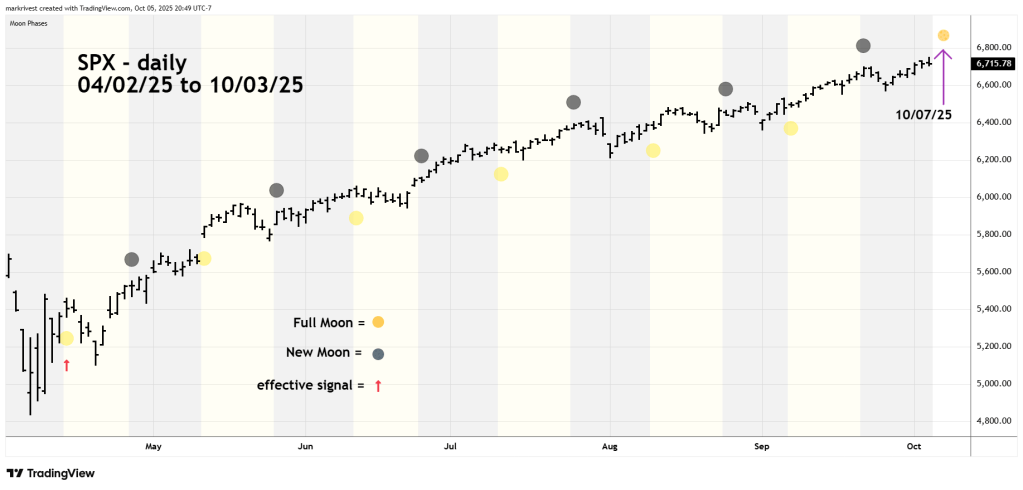
There has been only one effective lunar signal.
There’s a Full Moon on 10/07/25, the time window for an SPX peak is from 10/07/25 to 10/09/25. If the SPX peaks in that zone and declines into next week, a 5 to 10% decline could be underway.
Something larger than a 10% decline could occur. We may not have any clues about that happening for several weeks.
