Three converging trendlines could be resistance for the Dow Jones Industrial Average (DJI).
The weekly DJI chart courtesy of Trading View Illustrates the long – term view.
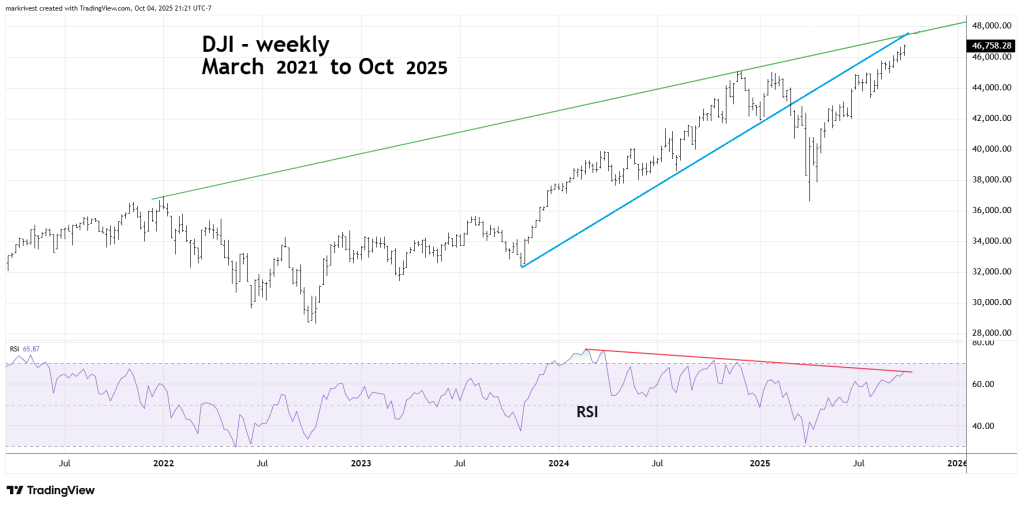
The trendline connecting January 2022 and December 2024 peaks could be reached during the week of 10/06/25 to 10/10/25.
Sometimes prior support trendlines could become resistance. In this case the DJI is also close to the prior support trendline connecting the October 2023, August 2024, and January 2025 bottoms.
Also note the multiple bearish RSI divergences.
The DJI – 4 – hour bar chart zooms in on recent action.
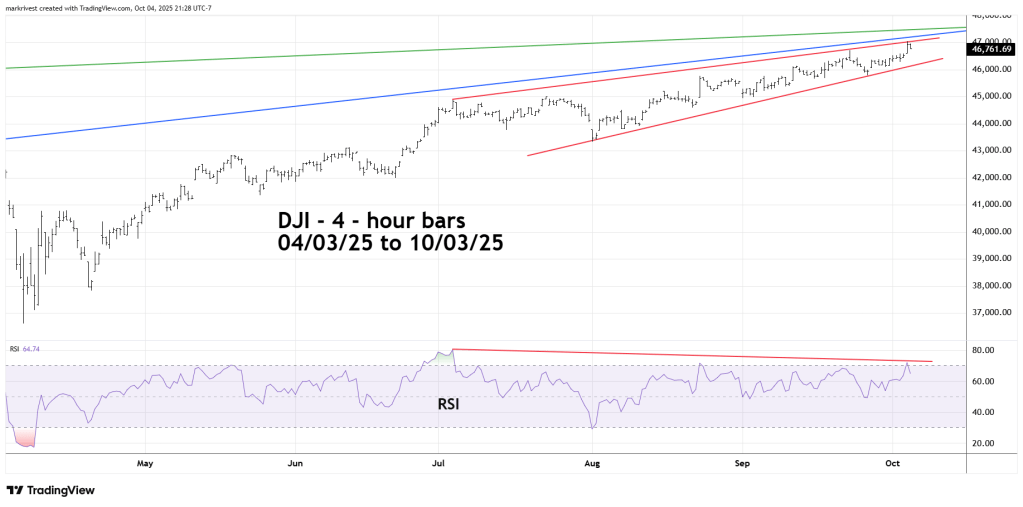
The upper trendline of the rising wedge is close to the longer term trendlines.
Broad DJI topping zone is from 47,200 to 47,500.
Time zone for a potential peak is 10/06/25 to 10/08/25.
