The Dow Theory was developed in the early twentieth century. One of the theories’ main principles was the relationship between the Dow Jones Industrial Average (DJI) and the Dow Jones Transportation Average (DJT) – previously the Rails Average.
A bearish divergence between the two averages was a signal of a looming bear market. A bullish divergence between the two was a signal for a bull market.
Decades after the development of this indicator the economy has changed dramatically. There are now industries such as Biotechnology that didn’t exist in the early twentieth century. Therefore, the Transportation Average is a much smaller component of the broad economy.
Even though the Transports are no longer a dominant part of the economy they can still gauge the health of a stock bull market.
The Trading View DJT and DJI chart using 3 – month bars illustrate their relationship since the start of the secular bull market in March 2009.
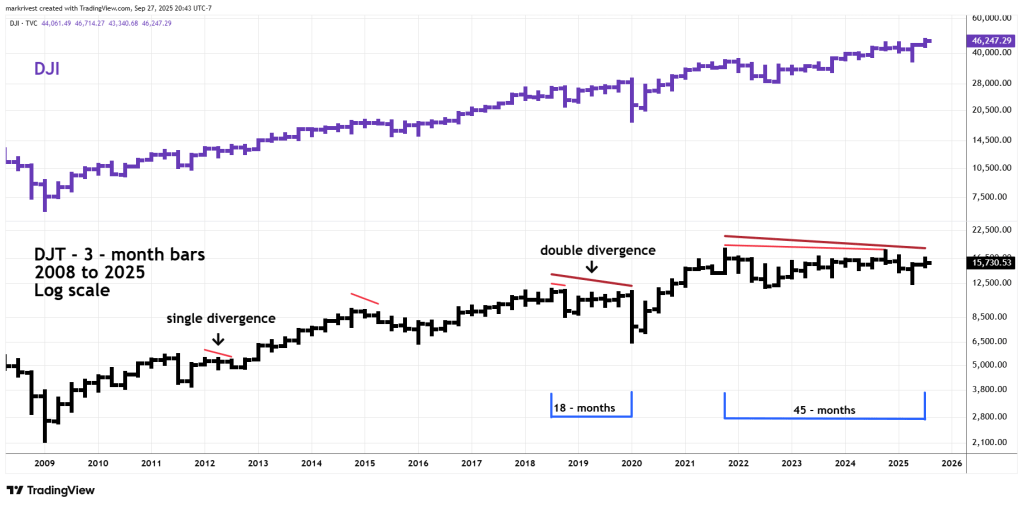
The thin red lines represent single bearish divergences. The thick maroon lines represent double bearish divergences.
When the divergence between the two averages was developed the timing of a potential trend change was more precise: perhaps within one or two months. Because the Transports are now a much smaller part of the economy the bearish divergences are broader.
The first bearish divergence occurred in 2012, which was the early part of a strong steady multi-year bull phase. The result was only a narrow sideways trend.
More than two years later the bulls were weakening, in this case a six-month bearish divergence was the prelude to a DJI bear market that lasted from April 2015 to January 2016, declining about 15%.
At the more advanced stage of the secular bull market in 2018, a three-month bearish divergence was the prelude to a DJI three – month decline of 17%.
This divergence was only the first part of a still developing double bearish divergence.
The eighteen – month double divergence was the prelude to the Covid – two-month 35% crash. The length of the double divergence hints that the U.S. stock market may have had a significant bear market even if the Covid crisis never happened. It’s possible that without the Covid panic, stocks could still have had a bear market. In this case lasting perhaps one year instead of two – months.
The situation between the two indices since late 2021 has been the most bearish since March 2009. The single bearish divergence lasted thirty – six months! The double bearish divergence has lasted an incredible forty – five months!
This divergence could be signaling a bear market that lasts for more than a year.
Anything can happen in the markets. If in the next few weeks, the DJI and DJT both make new all-time highs it could signal that the current bull market continues well into 2026.
If a bear market develops its possible U.S. stocks trend down into early 2027.
