The S&P 500 (SPX) decline from the 09/23/25 peak appears to be corrective. If so, the SPX could reach a new all-time high sometime next week.
The 15 – minute SPX chart courtesy of Trading View illustrates the intraday action.
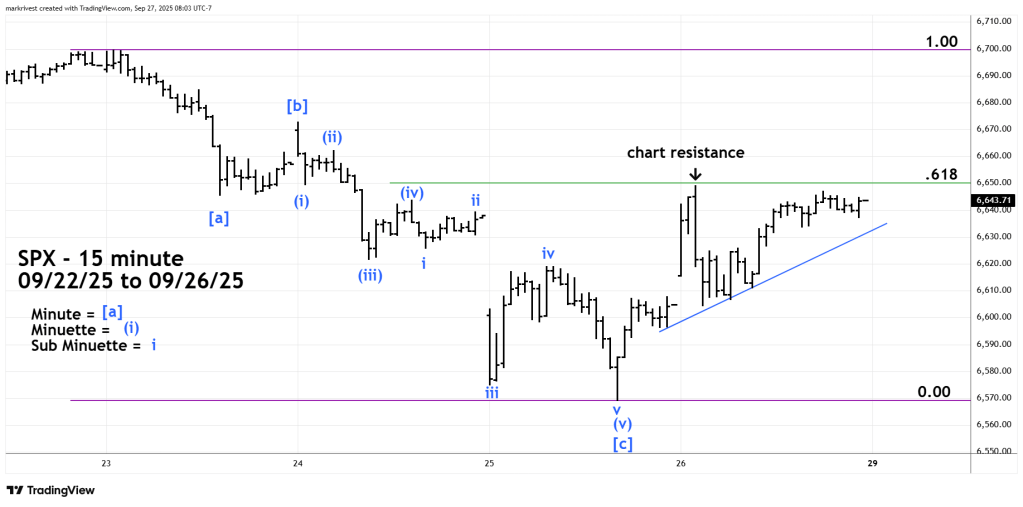
There are always alternate wave counts in Elliott analysis. This chart shows the bullish interpretation of what could be developing. SPX 6,650 is a Fibonacci .618 retracement of the recent decline. This is also very close to chart resistance made early in the 09/26/25 session. A move above this dual resistance requires powerful force.
Breaking decisively above 6,650 opens the door for a bull attack on the next chart resistance point at 6,672; noted in the 09/26/25 blog.
If there’s downside action, watch the rising trendline from the late 09/25/25 bottom. Important chart support is in the 6,602 to 6,606 area.
