On 09/05/25 all three main U.S. stock indices: S&P 500 (SPX), Dow Jones Industrial Average, and the Nasdaq Composite gapped up and made new all-time highs. A bullish signal. However, minutes after the session opening all three indices peaked and went into a vicious decline.
SPX fell 88 – points in 90 – minutes and went below its prior day bottom! This rapid rejection of new – highs could be a longer – term bearish omen.
The SPX 30 – minute chart courtesy of Trading View illustrates what could be developing.
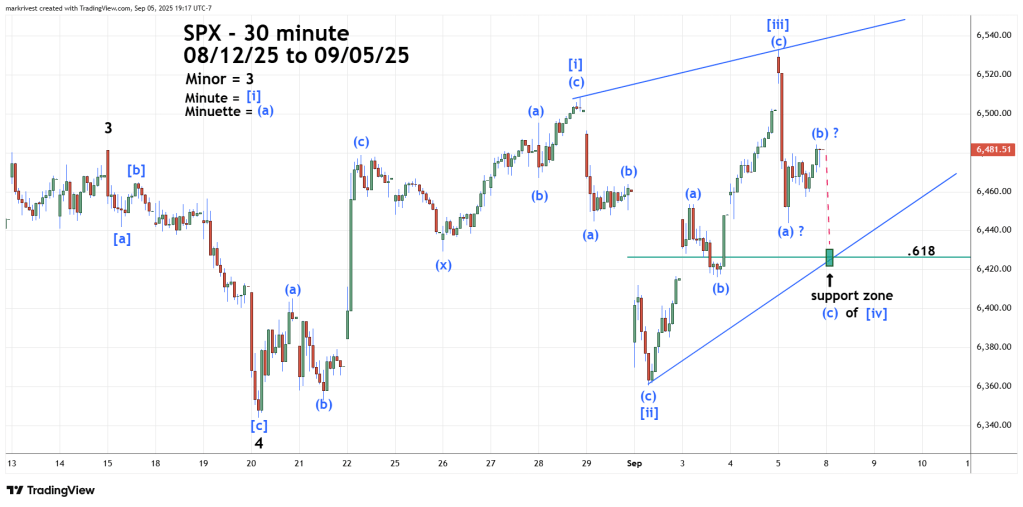
An Elliott wave – Ending Diagonal Triangle (EDT) could be forming since the 08/20/25 bottom.
R.N Elliott wrote that EDT’s form after a market has moved too far too fast. For the last few months this website has illustrated potential EDT’s because the manic post 04/07/25 rally is a perfect example of a market that’s’ moved too far too fast.
EDT’s are a termination pattern of the larger degree movement. They are composed of five – waves, each of which sub divide into three waves or a combination of three waves. They form in a wedge, and the fourth wave of the structure almost always crosses over into the territory of the first wave.
Typically, the second wave retracement of an EDT is deep, frequently exceeding 62% which in this case does go deep. Fourth waves of an EDT can also have deep retracements sometimes reaching the area of 62%.
The SPX strong drop on 09/05/25 has the look of an impulse wave. If so, the move up is likely to be a correction of the decline followed by another drop. Please note the move up as of the 09/05/25 session close was a three-wave corrective pattern.
If this wave count is correct the SPX could have a decline in the first hour of trading on 09/08/25.
Watch the area around SPX 6,410 to 6,430 for a potential short- term bottom.
If the SPX breaks below 6,360.58 before exceeding the 09/05/25 high, it will invalidate the EDT wave count and open the door for at least a multi-week bear move.
