There are two ways to discover potential Fibonacci time cycles. Using Fibonacci sequence numbers to measure a market time segment. The Fibonacci sequence is as follows (1,1, 2, 3, 5, 8, 13, 21, 34, 55, 89, 144, 233, to infinity). This method was illustrated in the prior blog and examined several examples of the Dow Jones Industrial Average moving in segments of five – Fibonacci years.
The other method compares two or more market segments for a potential Fibonacci ratio relationship. The main Fibonacci ratios are as follows (.236, .382, .50, .618 and 1.00 – equality or one/one). Please note the component numbers of the ratio do not have to be Fibonacci sequence numbers. Any numbers are acceptable: the key point is they have a Fibonacci ratio relationship.
This methodology was shown in the 08/10/25 blog “Time Cycles – August 2025”.
The monthly S&P 500 (SPX) chart courtesy of Trading View updates the monthly chart illustrated in that blog.

There’s always leeway when using Fibonacci ratio analysis. Hitting an exact Fibonacci ratio in either price or time is rare. The closer the market gets to an exact Fibonacci ratio it increases the chances of a potential market turn.
The 08/10/25 blog noted that the presumed Primary wave [1] lasted 131 – months. The presumed Primary wave [3] with a July 2025 peak lasted 64 – months for a ratio of 64/131 or .488.
The SPX continued its rally into August making the ratio 65/131 or .496 almost an exact Fibonacci .50 ratio.
The next SPX chart updates the weekly SPX chart shown in the 08/10/25 blog.
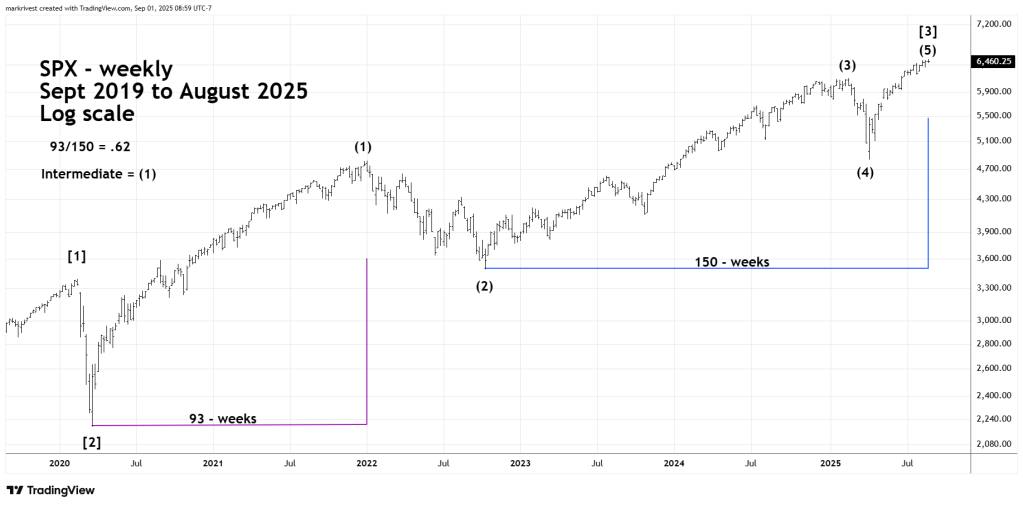
The presumed Intermediate wave (1) lasted 93 – weeks. The presumed Intermediate waves (3) through (5) going into a July peak was 146 – weeks a ratio of 93/146 or .636.
The SPX rally continued into the last week of August, bringing the ratio to 93/150 or .62, almost an exact Fibonacci .618 ratio.
The Fibonacci Time sequence of five – years gives a broad indication of a significant downturn for U.S. stocks sometime in 2025.
U.S. stock market seasonal patterns are bearish from August to October. This narrows the focus as to when in 2025 a down move could occur.
Weekly Fibonacci ratios zoom in on either the last week of August or the first week of September for a potentially major U.S. stock market peak.
The U.S. stock market made a major peak in the first week of September 1929. What followed was a market crash.
The U.S. stock market made a major peak in the last week of August 1987. What followed was a market crash.
