Sometimes markets move in time segments related to the Fibonacci sequence. The U.S. stock market could currently be in a Fibonacci sequence time segment.
Shortly after R.N Elliott discovered the wave theory now named after him he found that markets move in harmony with Fibonacci sequence numbers and ratios.
The Fibonacci sequence is as follows. (1, 1, 2, 3, 5, 8, 13, 21, 34, 55, 89, 144, 233, to infinity).
The monthly Dow Jones Industrial Average (DJI) chart courtesy of Trading View illustrates two of the Fibonacci Time sequences that Elliott discovered.
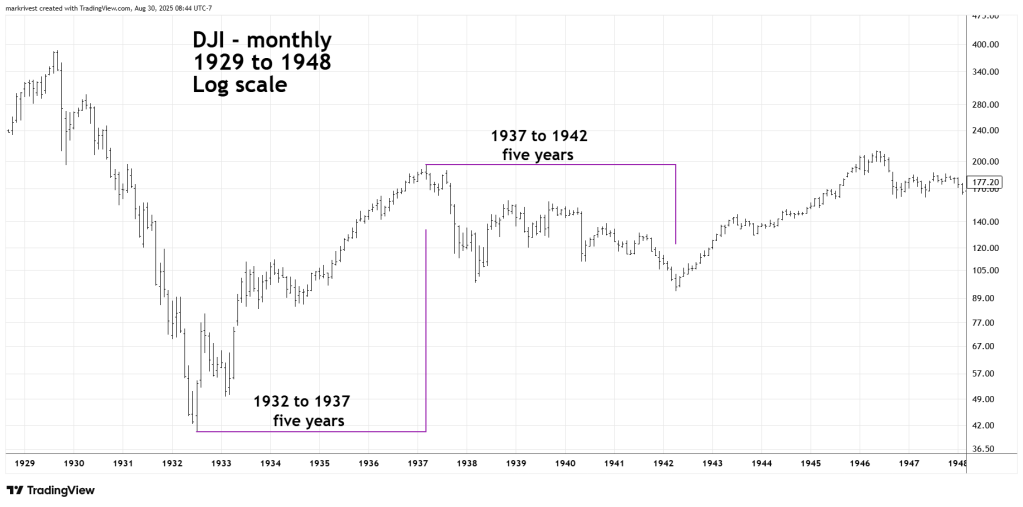
The DJI 1932 to 1937 was five – years a Fibonacci sequence number. The subsequent bear market 1937 to 1942 was also five – years. Please note when on a yearly time scale the segment does not have to be exact – round to the nearest year. The 1932 to 1937 bull market was 56 – months four months short of exactly five – years. The 1937 to 1942 bear market was 61- months.
Sometimes greater precision can be found analyzing monthly data. The same process could also be used at smaller time scales, daily, hourly, etc.
The next DJI monthly chart looks at the 1982 to 1987 bull market.
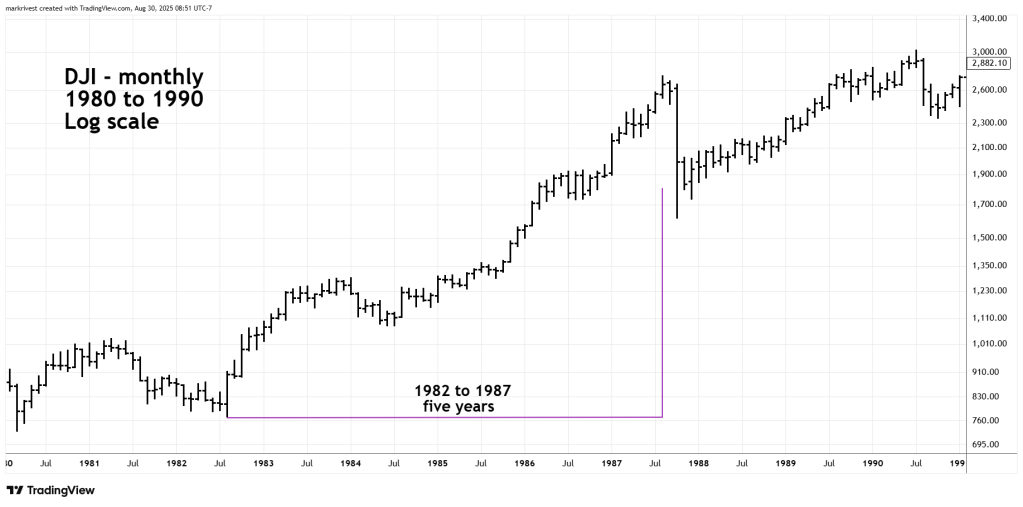
In this case there was precision to the month. The bull market began in August 1982 and ended in August 1987. Knowledge of the Fibonacci time sequence could have been valuable in July or August 1987 considering that what happened next was the worst stock market crash since 1929.
The next monthly chart examines the DJI 2002 to 2007 bull market.
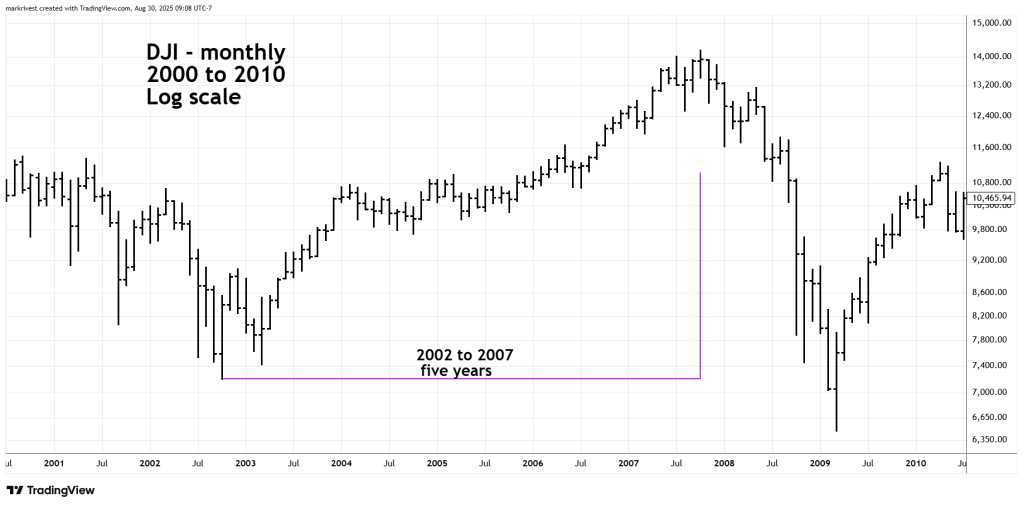
This is a very rare example of extreme precision. The bull market began 10/10/02 and terminated on 10/11/07. Almost the exact day! Again, knowledge of Fibonacci time sequences could have been helpful. In the subsequent bear market that terminated in 2009 the DJI declined more than 50%.
The next DJI monthly chart illustrates the current bull market that began in March 2020.
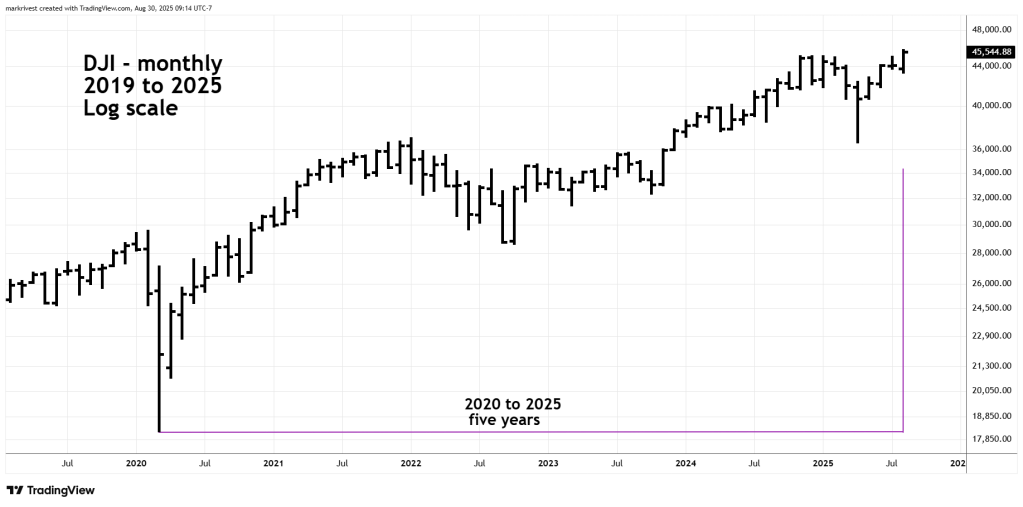
No monthly precision in the current bull phase which is now in month 65. Since there are still four months remaining in 2025 the rally could continue into December 2025 and still be a five- year sequence since March 2020.
U.S stock seasonal patterns are bearish from August to October and lower the probabilities that the current rally continues into December.
There is also a weekly Fibonacci time ratio that indicates a downside move could be imminent. This Fibonacci time ratio will be examined on this website next blog post.
