Internal momentum for the U.S. stock market continues to have bearish signals.
The six – month NYSE 52 – week high chart courtesy of Barchart.com illustrates a near – term bearish divergence.
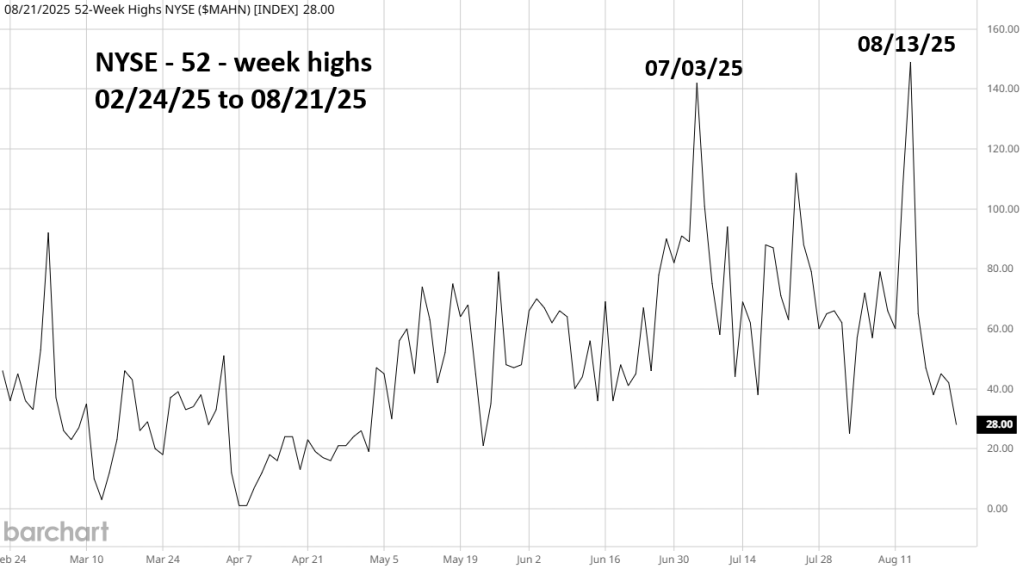
On 08/13/25 the NYSE new highs moved marginally above the reading made on 07/03/25.
However, on 08/19/25 when the Dow Jones Industrial Average made its solo all-time high, 52 – week highs had collapsed.
The situation is even more bearish when you zoom out to a one-year chart.
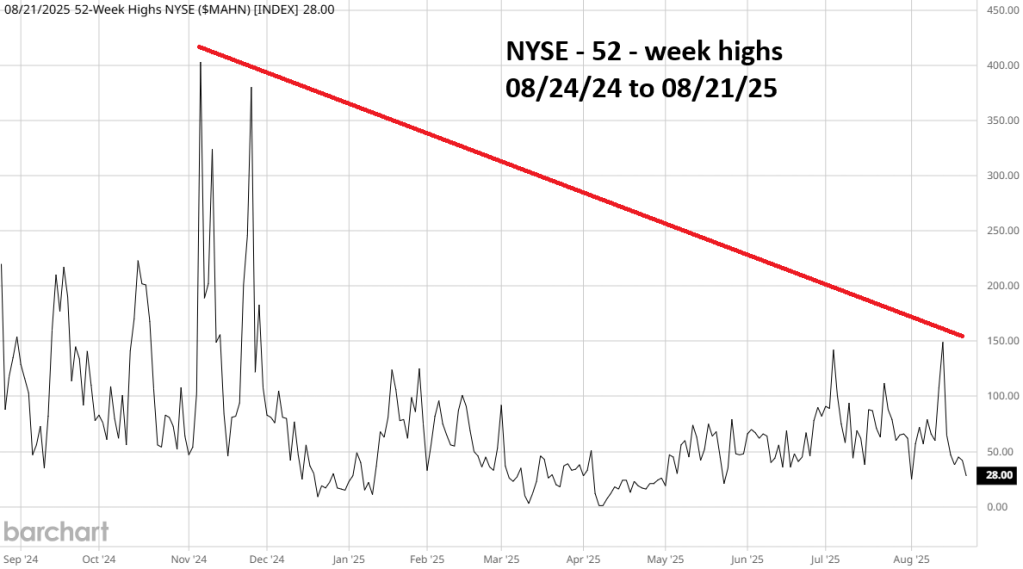
The longer – term divergence is outrageous.
The next chart courtesy of Stock.charts.com shows the NYSE – Advance/Decline line (A/D).
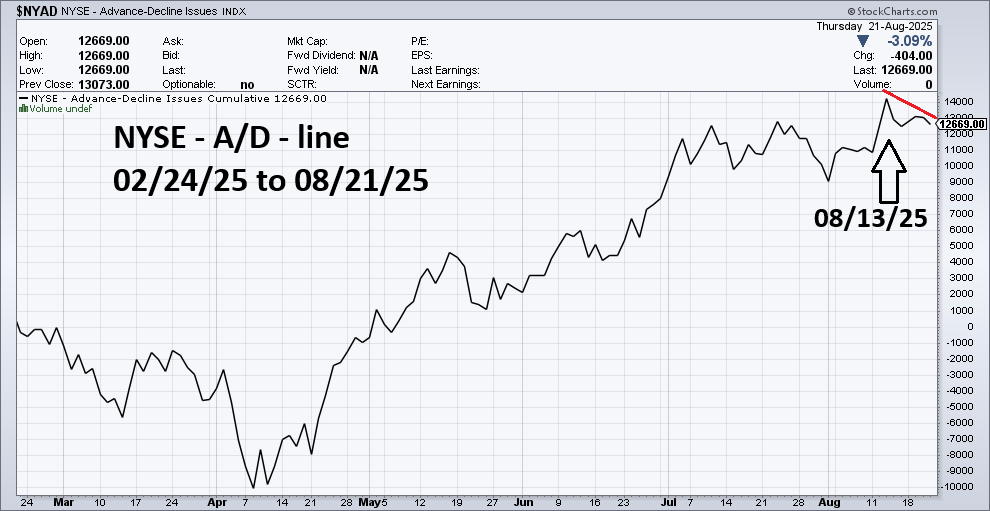
This internal momentum indicator also is showing a bearish divergence vs. the Dow Jones Industrial Average all- time high on 08/19/25.
U.S stocks are seasonally bearish from August to October. There could soon be a sharp and deep U.S stock market drop.
