There are two seasonal bearish patterns for U.S. stocks. April through May and August through October. In 2025 the S&P 500 (SPX) is roughly following the seasonal pattern it took in 1987.
The daily SPX chart courtesy of Trading View illustrates what happened in 1987 and 2025.
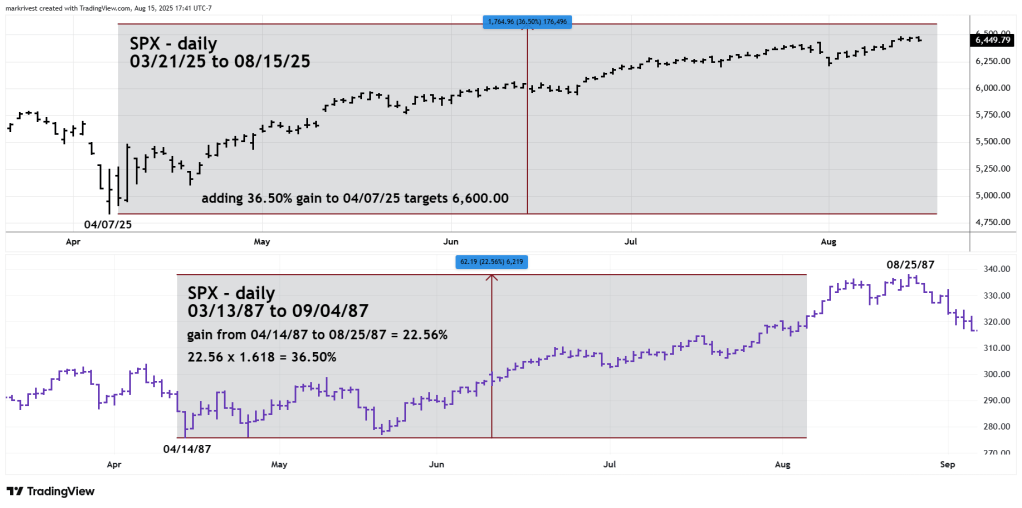
The SPX peaked in April 1987 then had about 9% decline forming a triple bottom that extended to May 1987.
The SPX bear move in 2025 was much more dynamic. The seasonal peak was early, peaking in February and bottomed early in April. The bear move was about 21%. Please note that the primary lows for both years occurred almost on the same calendar day. 04/14/87 vs. 04/07/25.
Because the 1987 April to May drop was much shallower than the 2025 decline the subsequent bull move into August 1987 was only 22.56% far less than the 2025 bull market.
Because of the fractal nature of markets there could be Fibonacci price relationships between movements separated by years or decades.
The bull move from April to August 1987 gained 22.56%, multiplied by the Fibonacci inverse ratio of 1.618 is 36.50%. The 36.50% gain added to the 04/07/25 bottom targets a potential peak at 6,600.00.
SPX Elliott wave pattern from the 08/01/25 bottom implies more upside action. Sentiment and momentum evidence for U.S. stocks also suggests more upside action.
There’s always leeway around Fibonacci coordinates. The broad zone for a potential SPX peak is 6,500 to 6,700.
An SPX peak could be made on or near 08/25/25.
