The 08/02/25 blog “S&P 500 – Elliott Wave Update – 08/01/25” illustrated that the S&P 500 (SPX) may have completed Minor wave “3” of the post 04/07/25 rally at the 07/31/25 peak. Subsequent price action strongly supports that wave count.
The two – hour SPX chart courtesy of Trading View updates the wave count since the 04/07/25 bottom.

Please note the series of waves “one’s” and “twos’” up from the 04/07/25 bottom.
The SPX 15 – minute chart zooms in on the action after the 08/01/25 bottom.
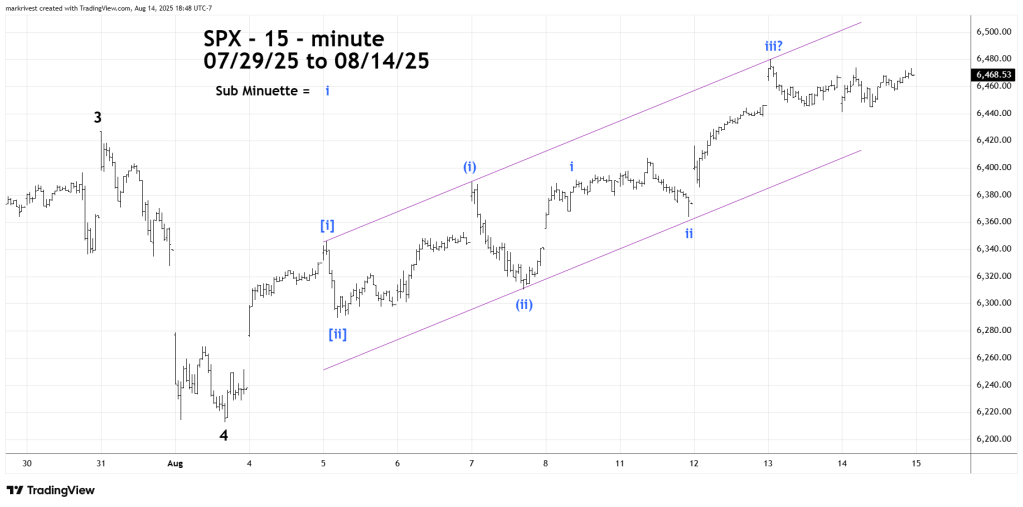
It appears the same phenomenon of a series of “one’s” and “twos up could be happening just after the 08/01/25 bottom.
If the rally continues the SPX could soon reach upper rising trendline in the mid – 6,500 area.
There’s also a fascinating time cycle that could be a factor. The SPX peak just prior to the 1987 October 1987 crash was 08/25/87. Perhaps another SPX major peak could come on 08/25/25.
