Three different time cycles indicate the U.S. stock market could be in a topping zone.
There are various methods to measure market or stock time cycles. Usually there’s broad leeway when using time cycles, precision is the exception not the rule.
Most markets have seasonal trends which can vary in regularity. For example, agricultural markets can be very regular. Stock markets have more sporadic seasonal patterns. The U.S. stocks market occasionally trends down between the months of August to October.
The sharp stock decline from August 1987 to October 1987 is a classic example. More recently U.S. stocks declined from August to October in both 2022 and 2023. With both the S&P 500 (SPX) and Nasdaq Composite at or near all-time highs we need to be wary of another August to October decline.
Elliott wave analysis also provides a way to measure time cycles. Waves of the same degree tend to have Fibonacci price/time relationships.
The monthly SPX chart courtesy of Trading View shows a very long – term Fibonacci time cycle.
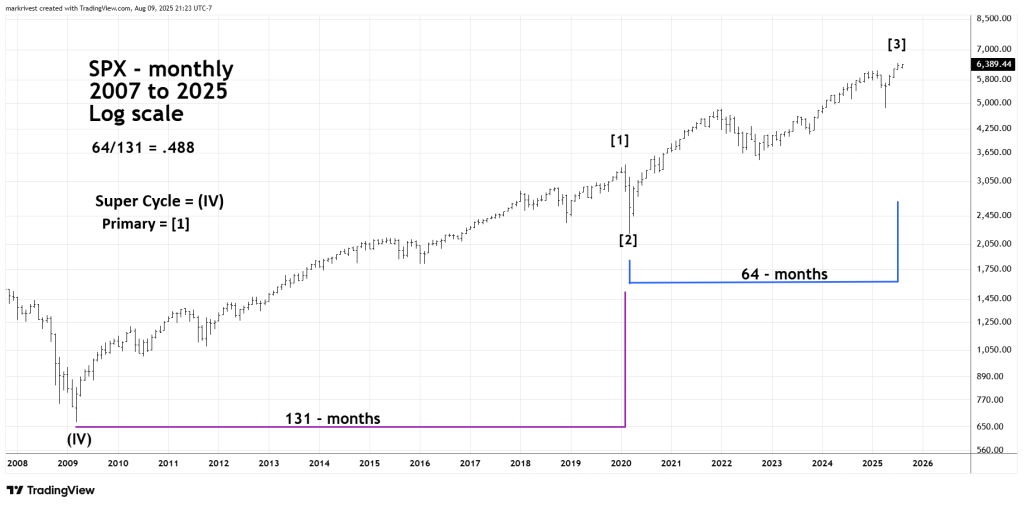
The secular bull market from 2009 to 2020 is a presumed Primary wave [1] and lasted 131 – months. After the Covid crash the rally into the July 2025 peak is a presumed Primary wave [3] which was 64 – months.
The ratio between the two waves is 64/131 or .488 close to the Fibonacci ratio of 1/2 or .50. If the SPX makes a new high in August 2025 the ratio would be 65/131 or .496.
The weekly SPX chart zooms in on the bull market from 2020 to 2025.
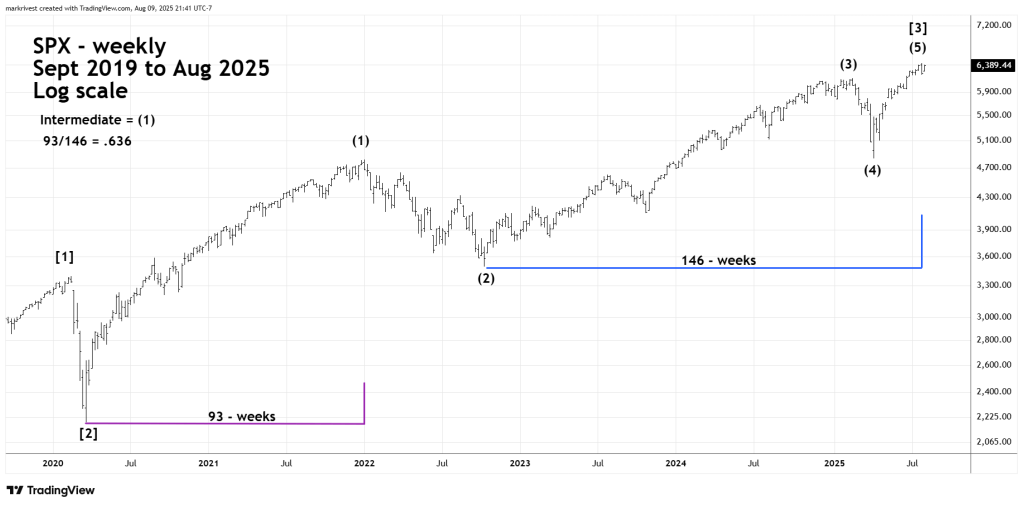
The move up from 2020 to 2022 is a presumed Intermediate wave (1) which lasted for 93 – weeks. The rally from October 2022 to July 2025 is presumed to be Intermediate wave (3) through Intermediate wave (5) and lasted 146 – weeks.
The ratio is 93/146 or .636 close to the Fibonacci Golden ratio of .618. If SPX makes a new all-time high during the week of 08/11/25 to 08/15/25 the ratio would be 93/147 or .632.
The daily SPX chart examines the Lunar time cycle.
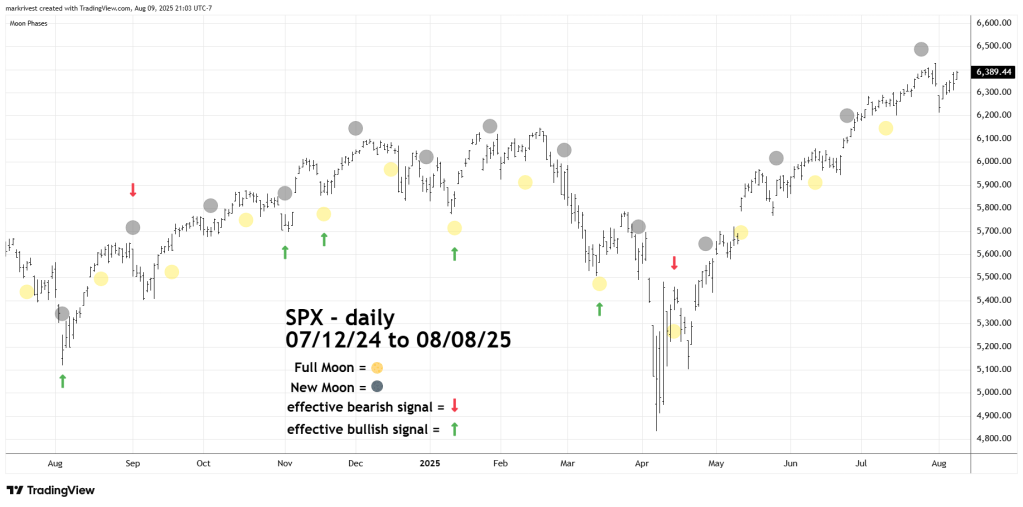
Occasionally markets can have turns plus or minus two trading days from a Full/New Moon.
Since mid-July 2024 there have been 26 – lunar cycles. Of these only 7 have been effective turn signals a ratio of .269. This is a low ratio, however the chances of a lunar cycle being effective increases during a high emotional period. The prior blog” Sentiment Update – 08/08/25” Illustrated that U.S. bullish sentiment is currently at a high level.
There was a Full Moon on Saturday 08/09/25. If a peak was not reached on 08/08/25 there could be another peak on 08/11/25 or 08/12/25.
